Data Visualization: Resolution Guide
Crime alerts often create anxiety because we receive information about incidents but not their outcomes. This project uses Georgia Tech Police Log disposition data to reveal how incidents are ultimately resolved.
Role: Designer & Developer
Tools: p5.js, ml5.js, photoshop
Duration: 3 months
Experiential Data Visualization: Georgia Tech Police Crime Log
Question:
How does access to case resolution metrics reshape your assessment of campus safety?
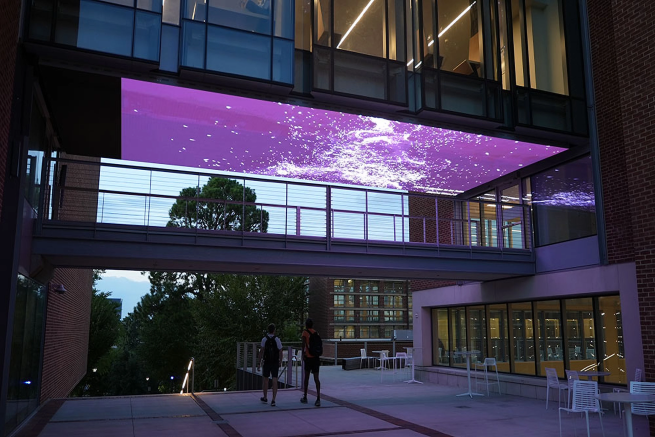
Purpose:
Georgia Tech Library Media Bridge as a “Relief Zone” for passerby
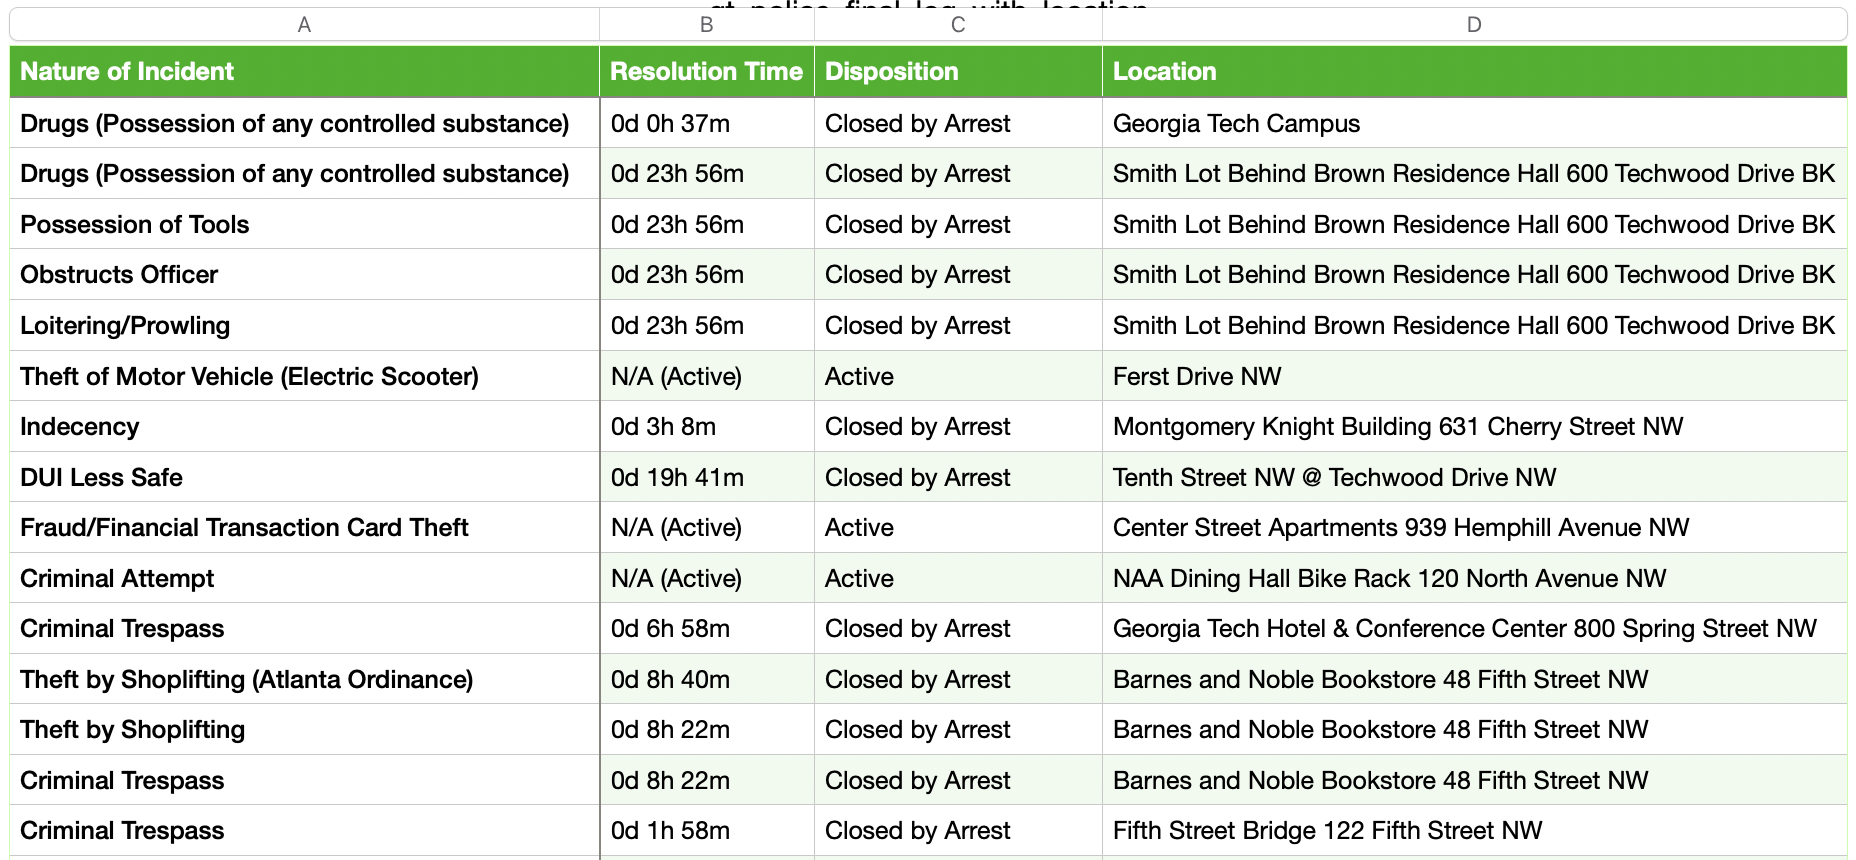
Data Collection
Disposition & Time log from Georgia Tech Police Log
CSV created from the log with just the information needed.
Record Date Range: 02.23.2026 - 04.23.2026
Categories: Nature of Incident, Resolution Time, Disposition, Location
Total of 241 data points
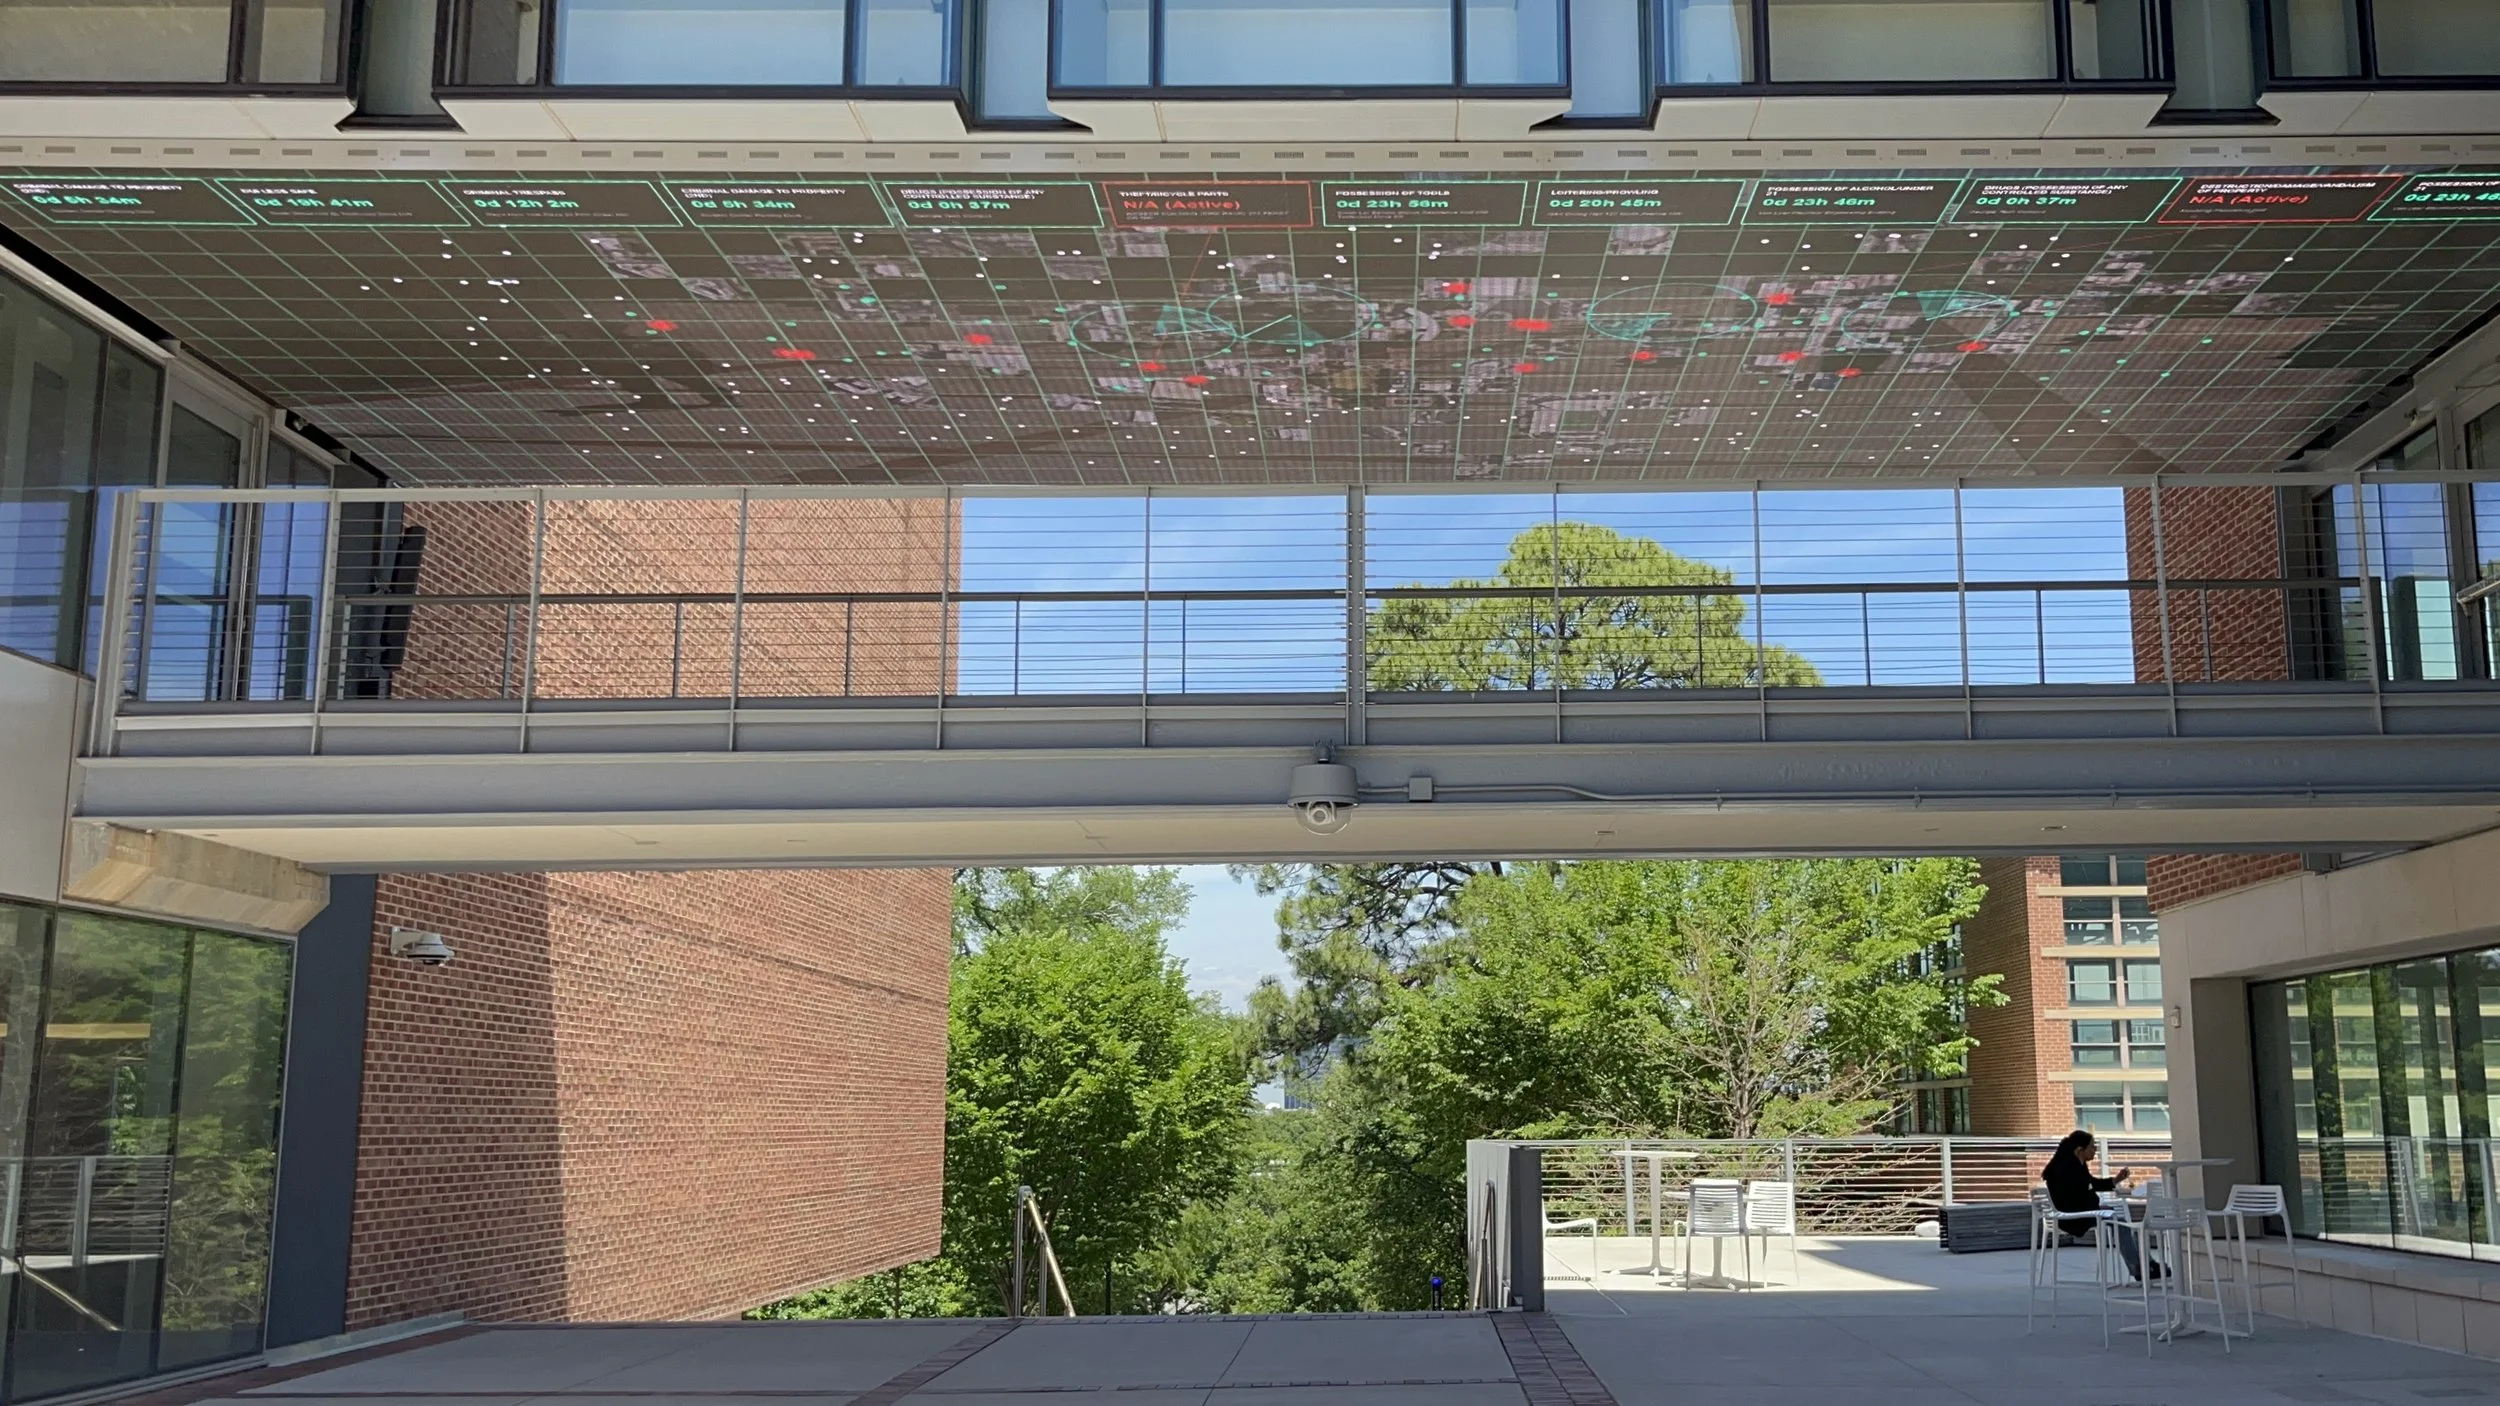
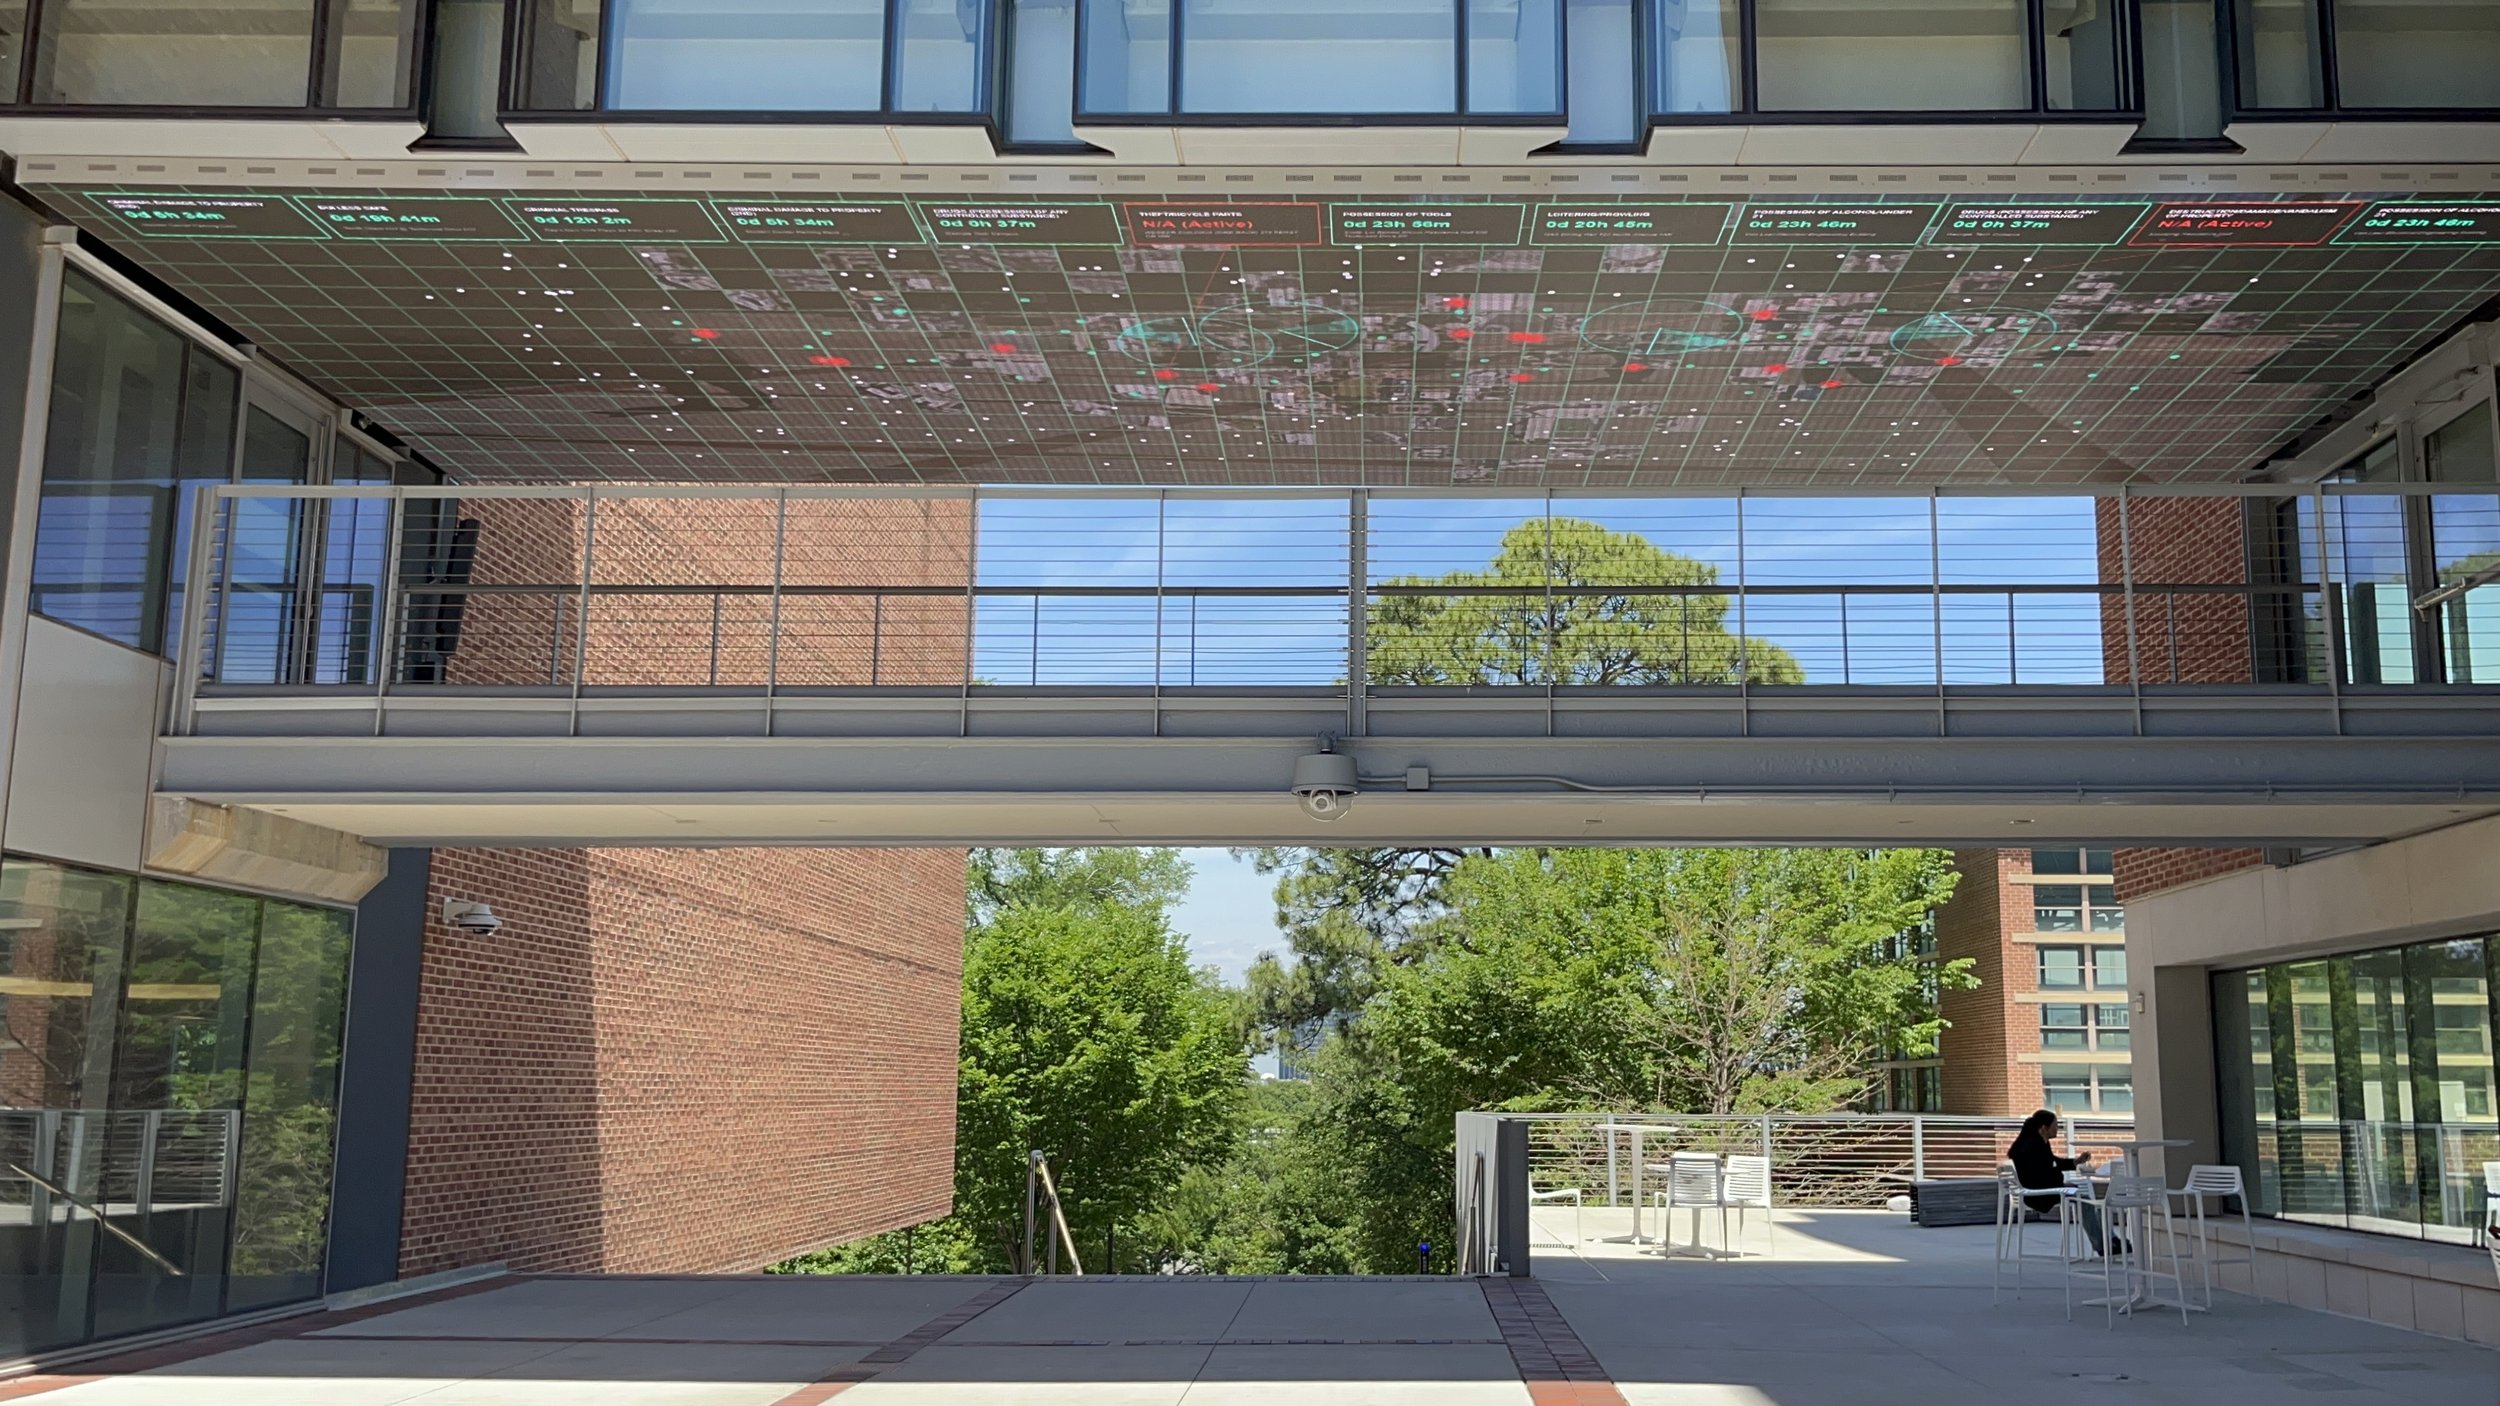
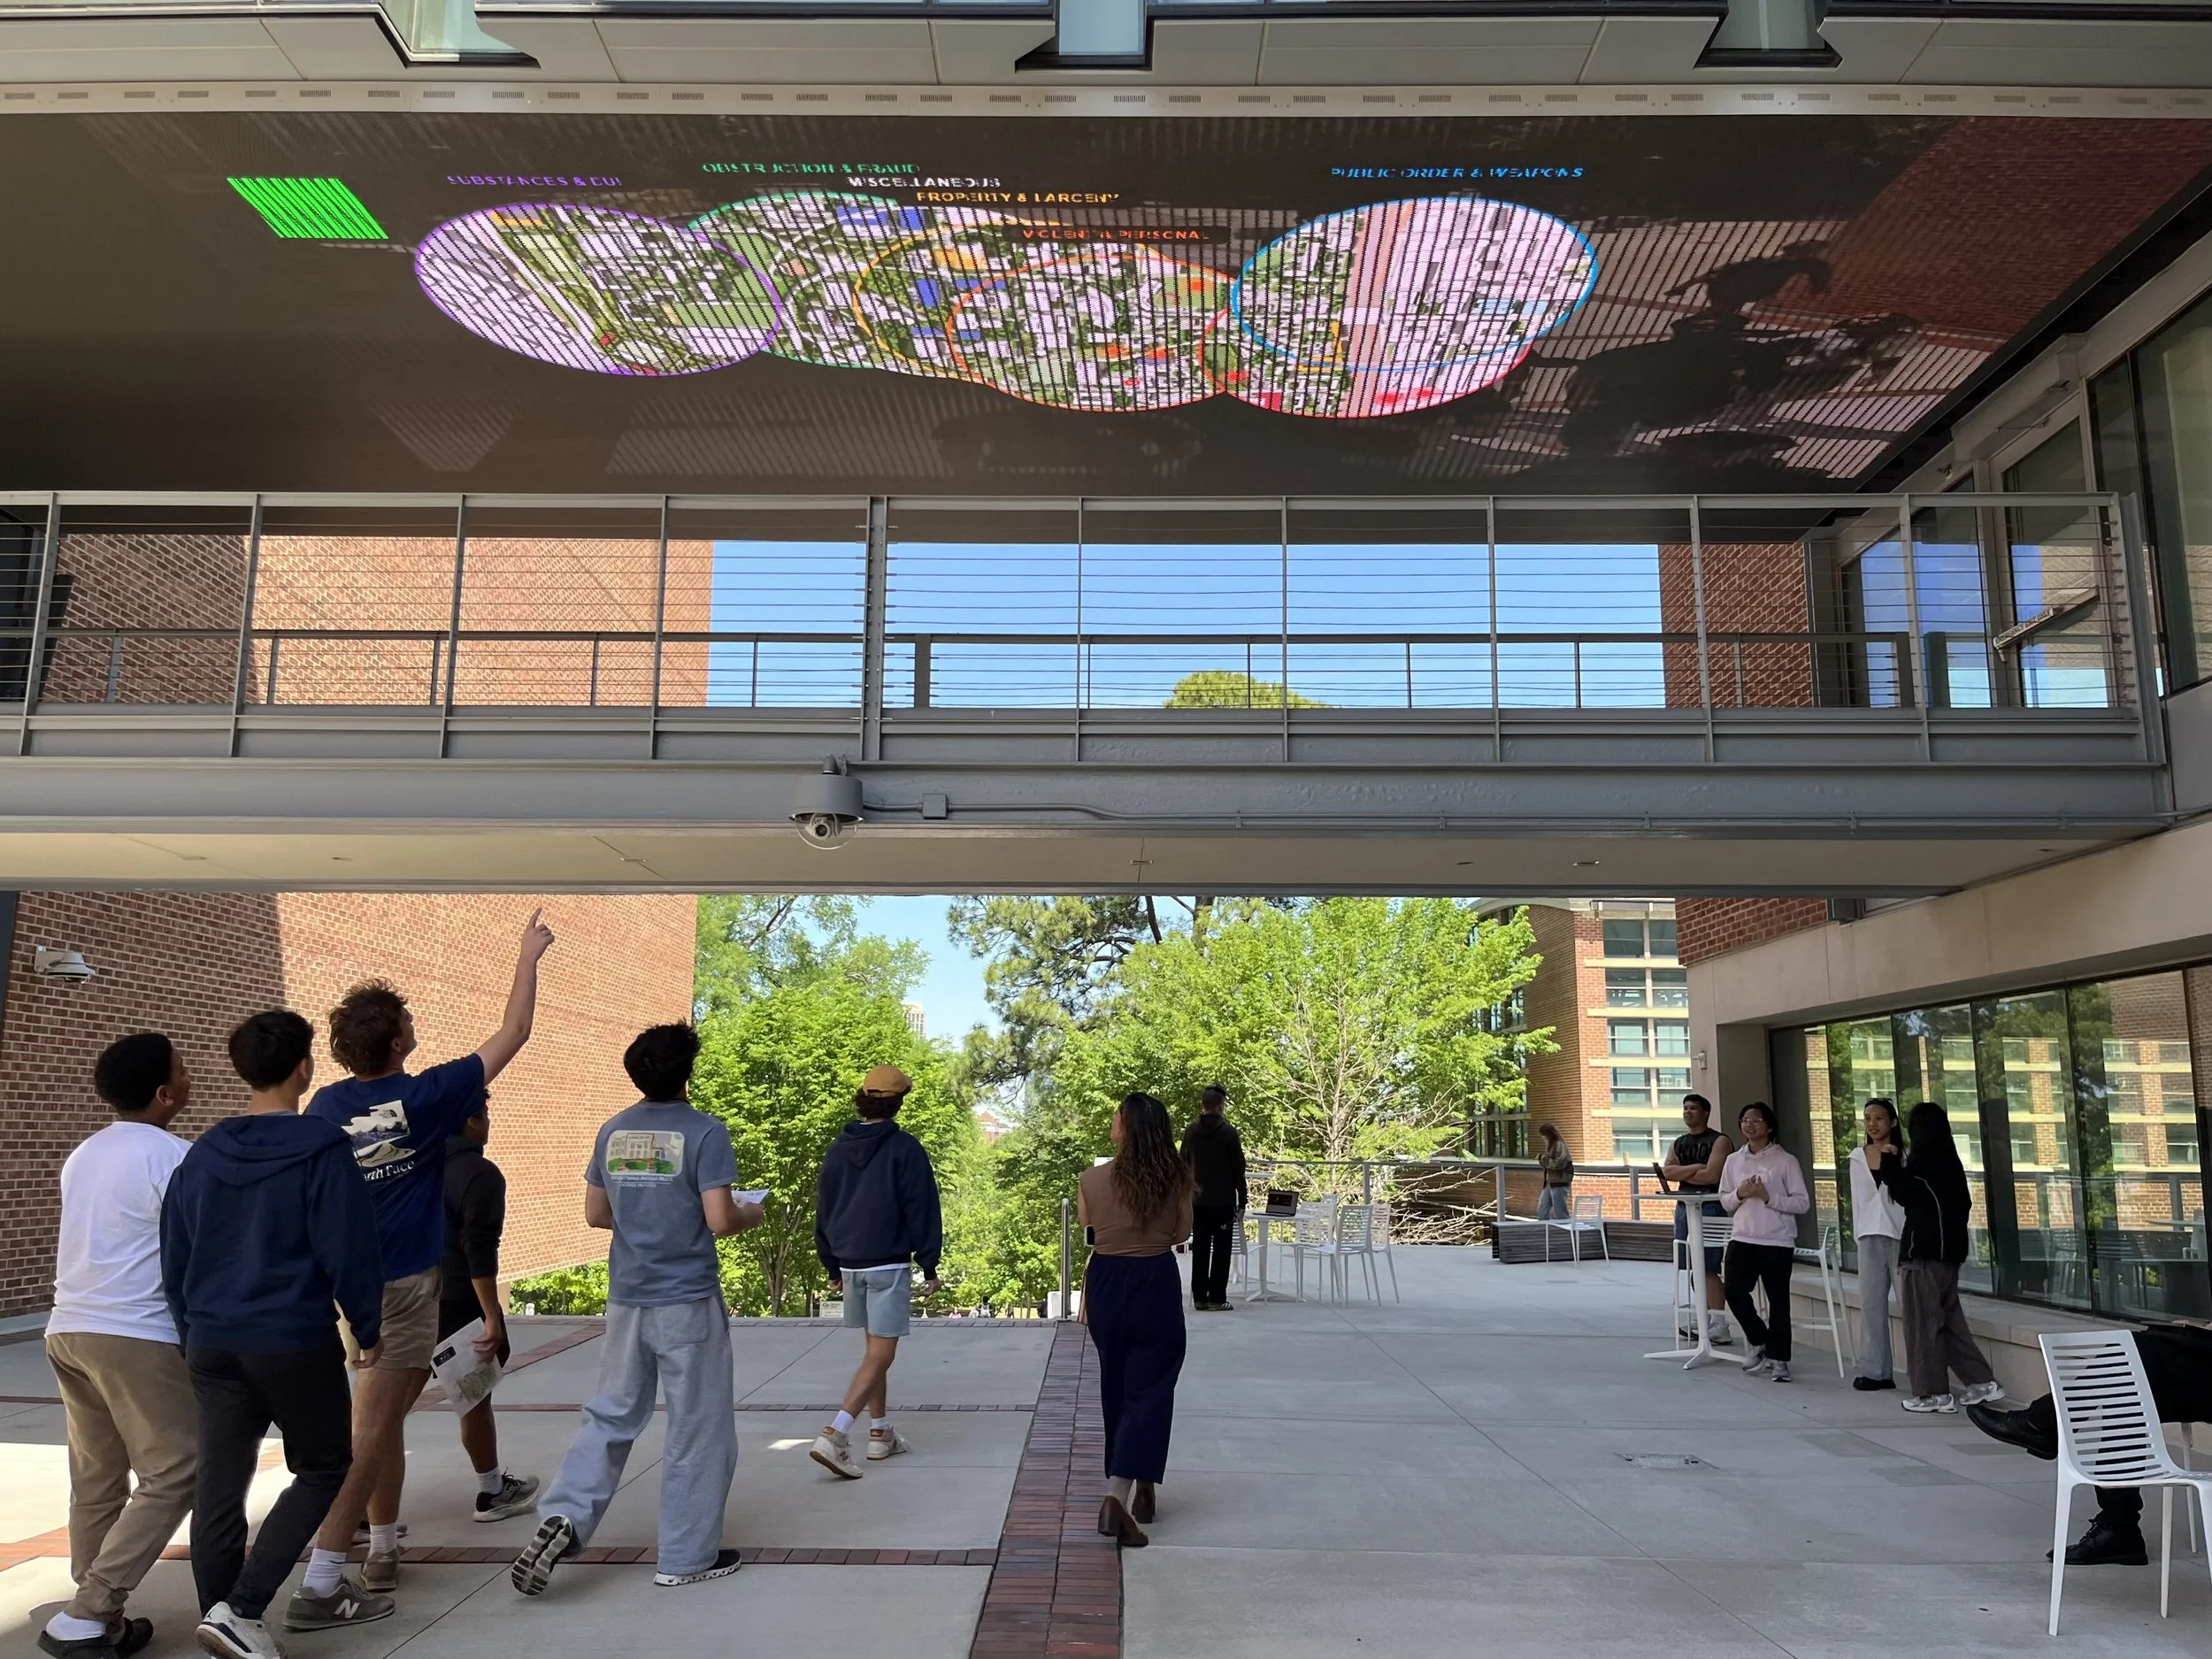
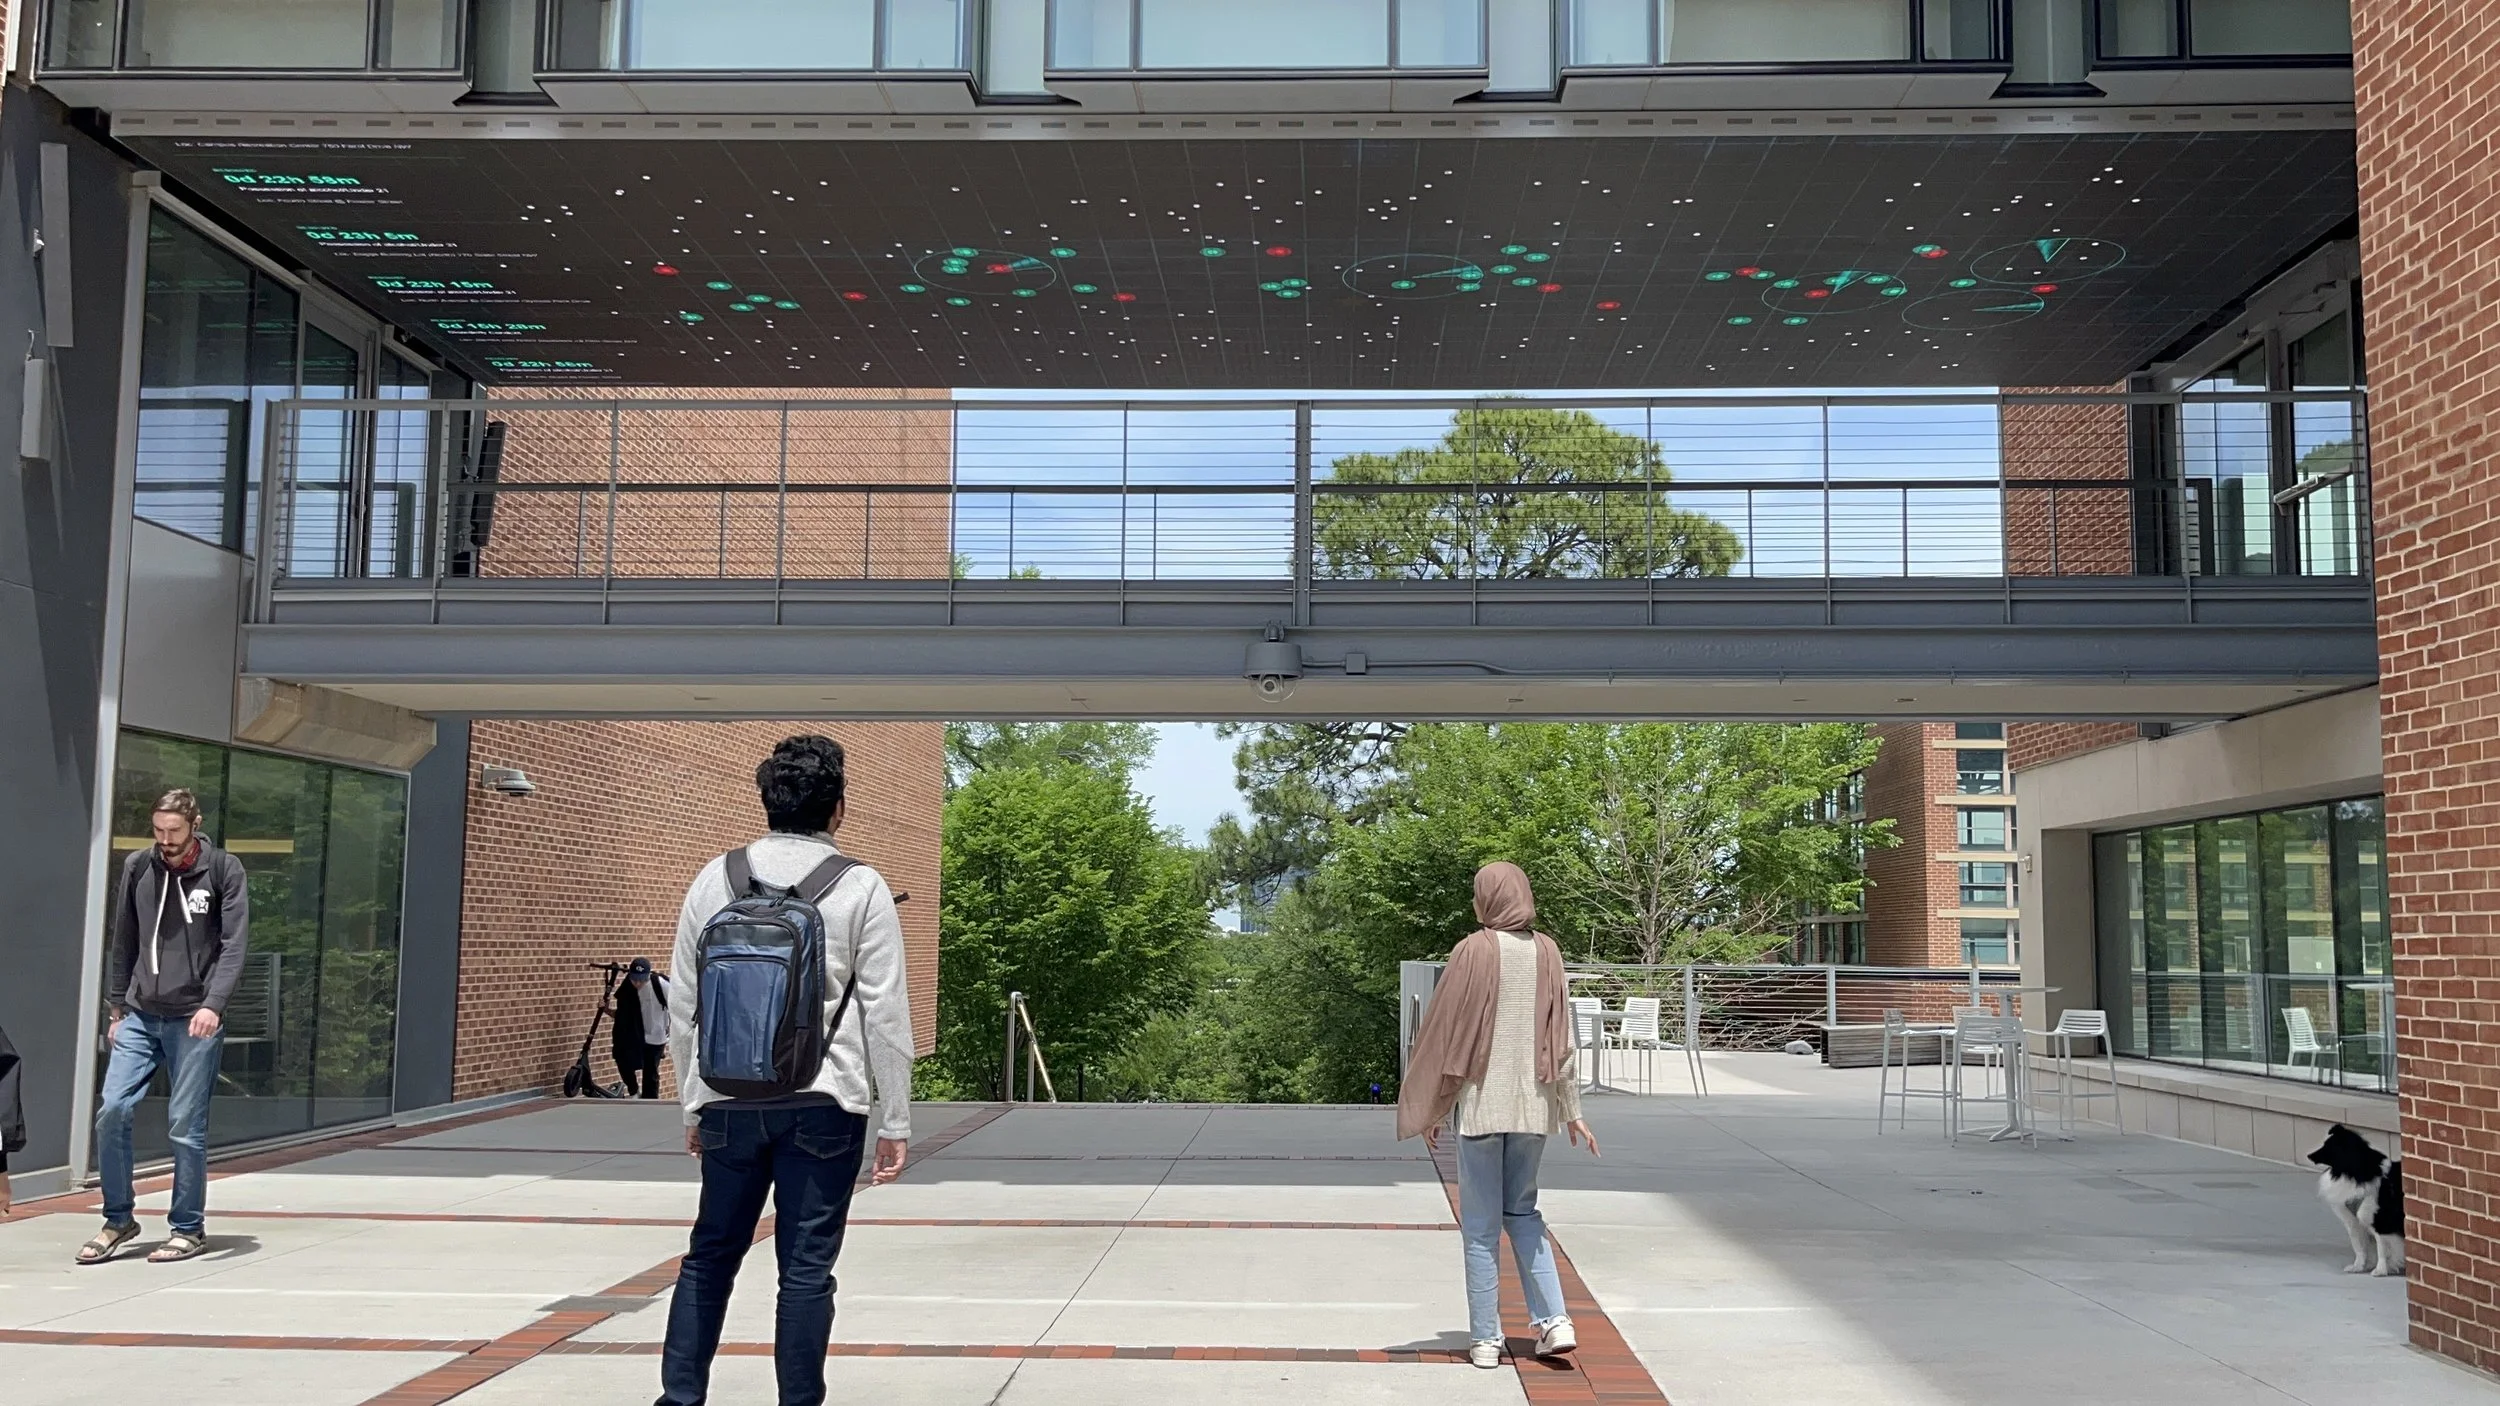
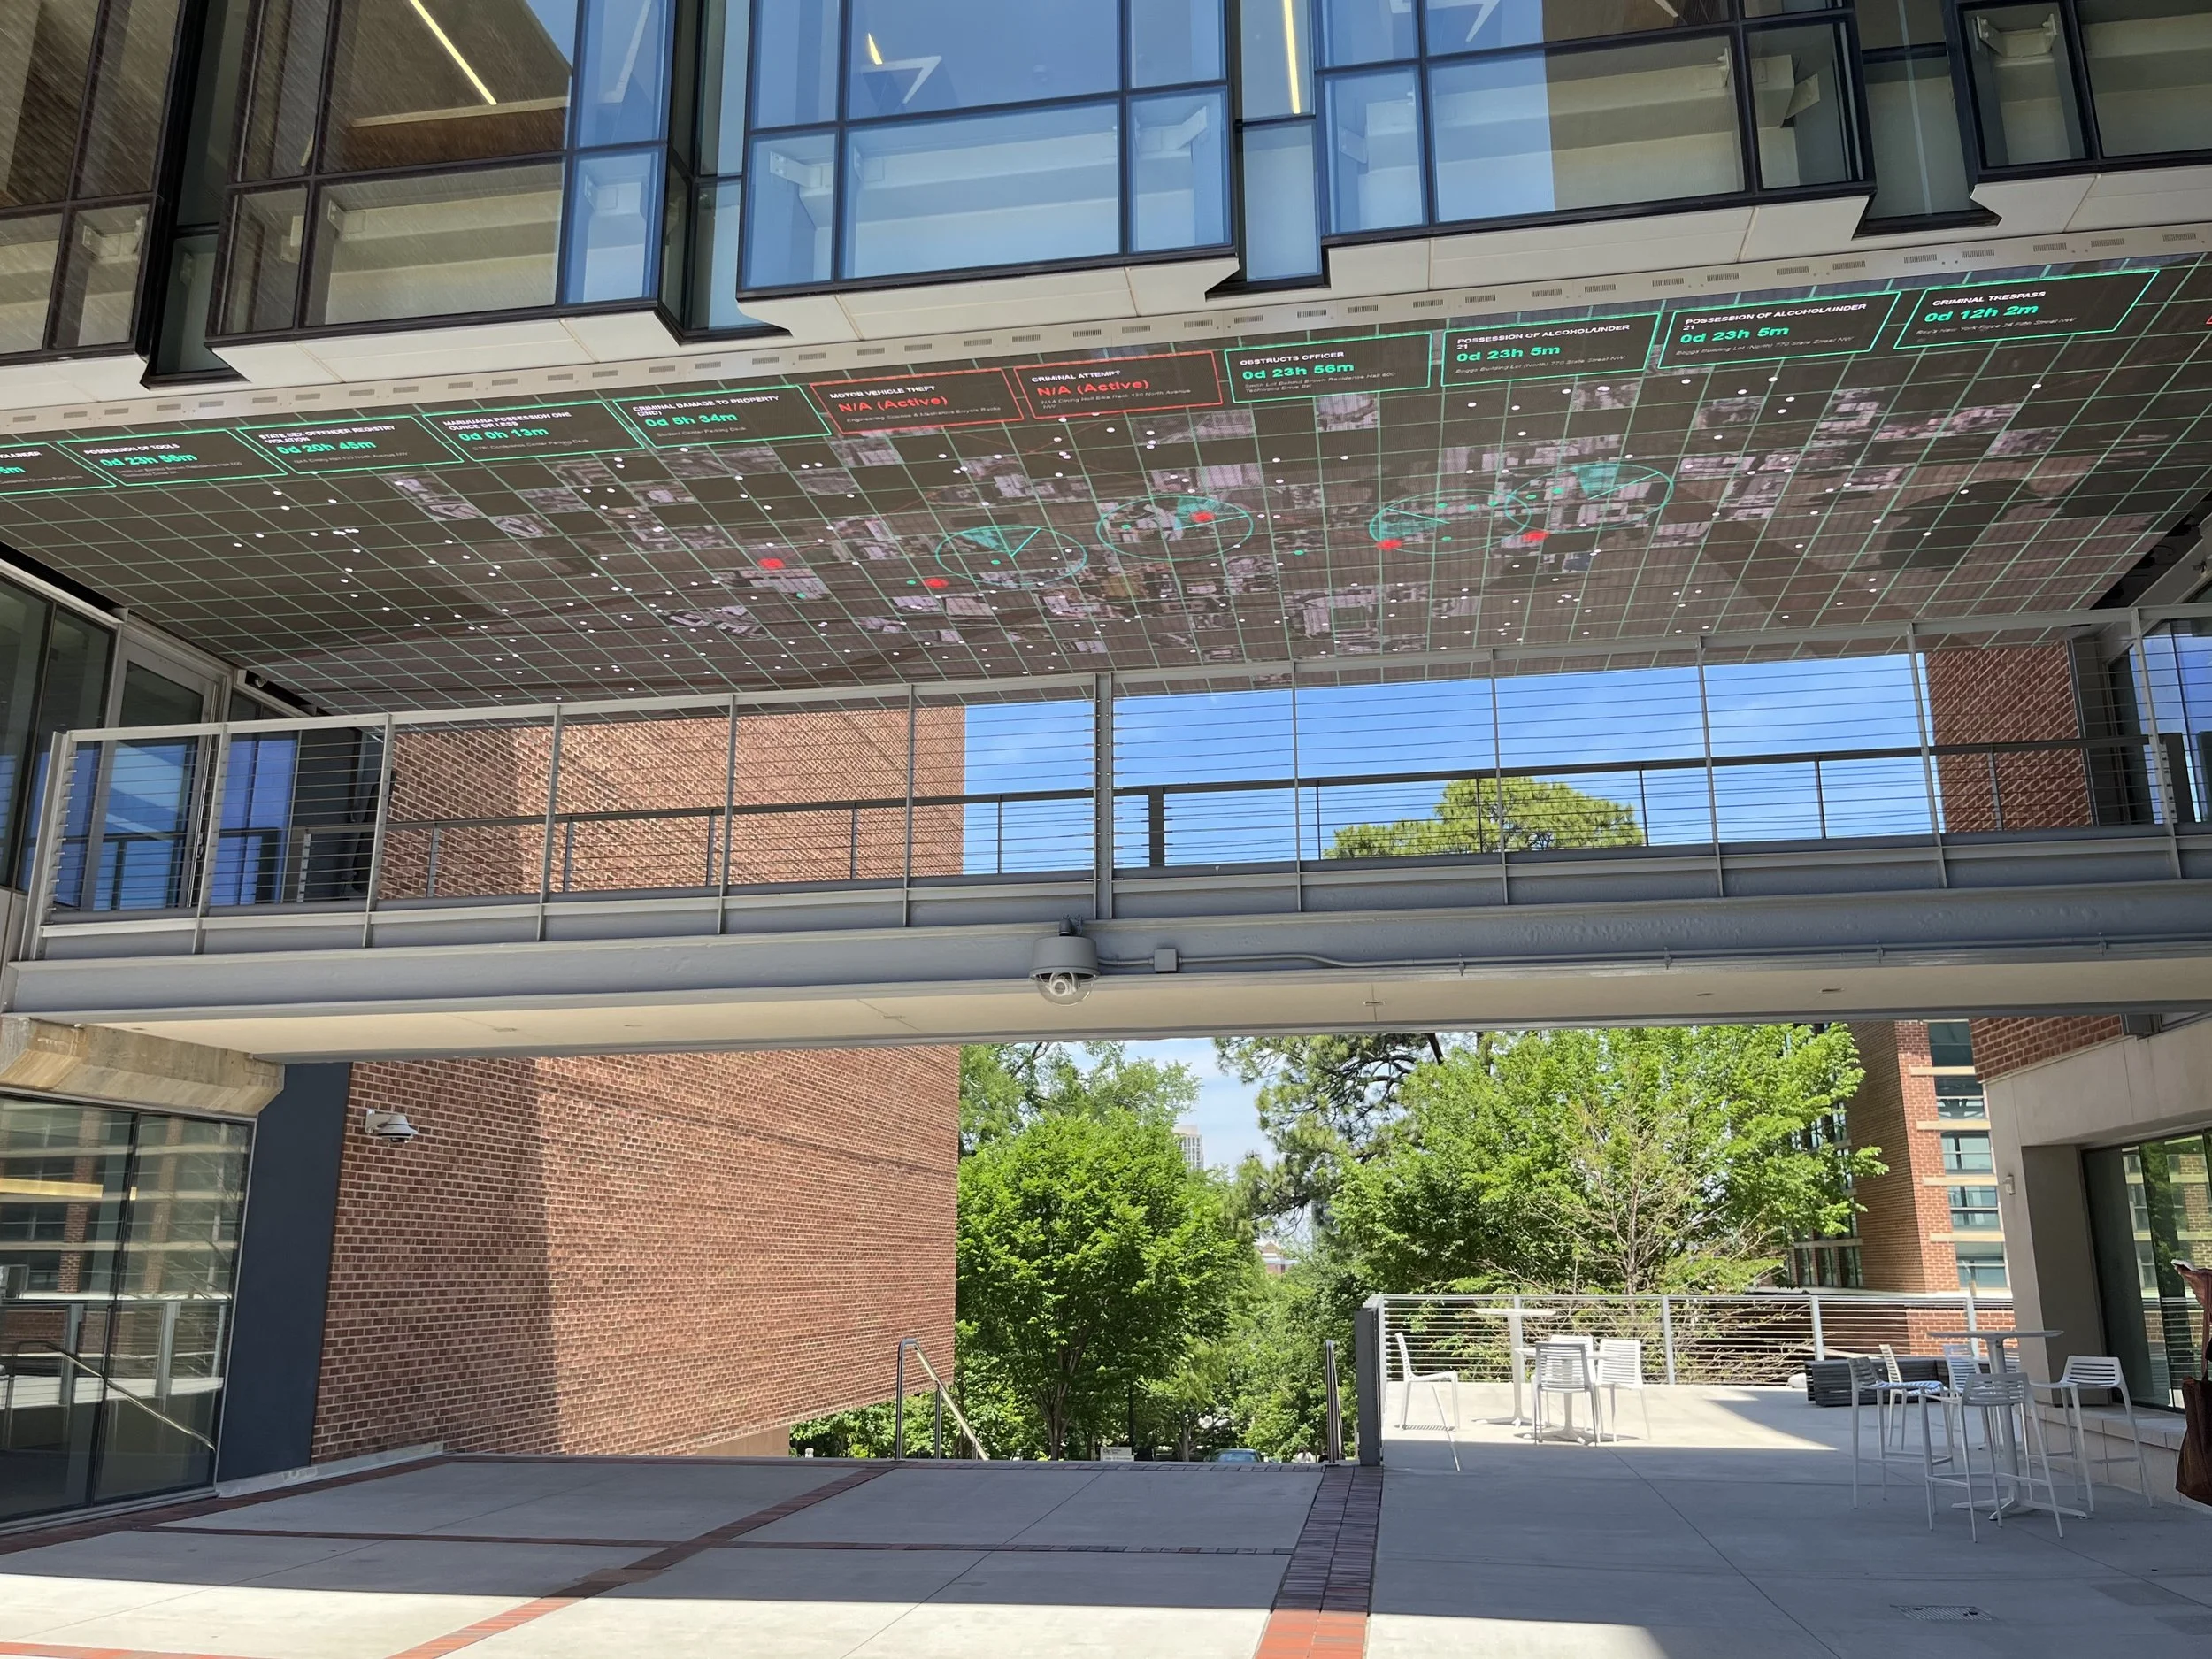
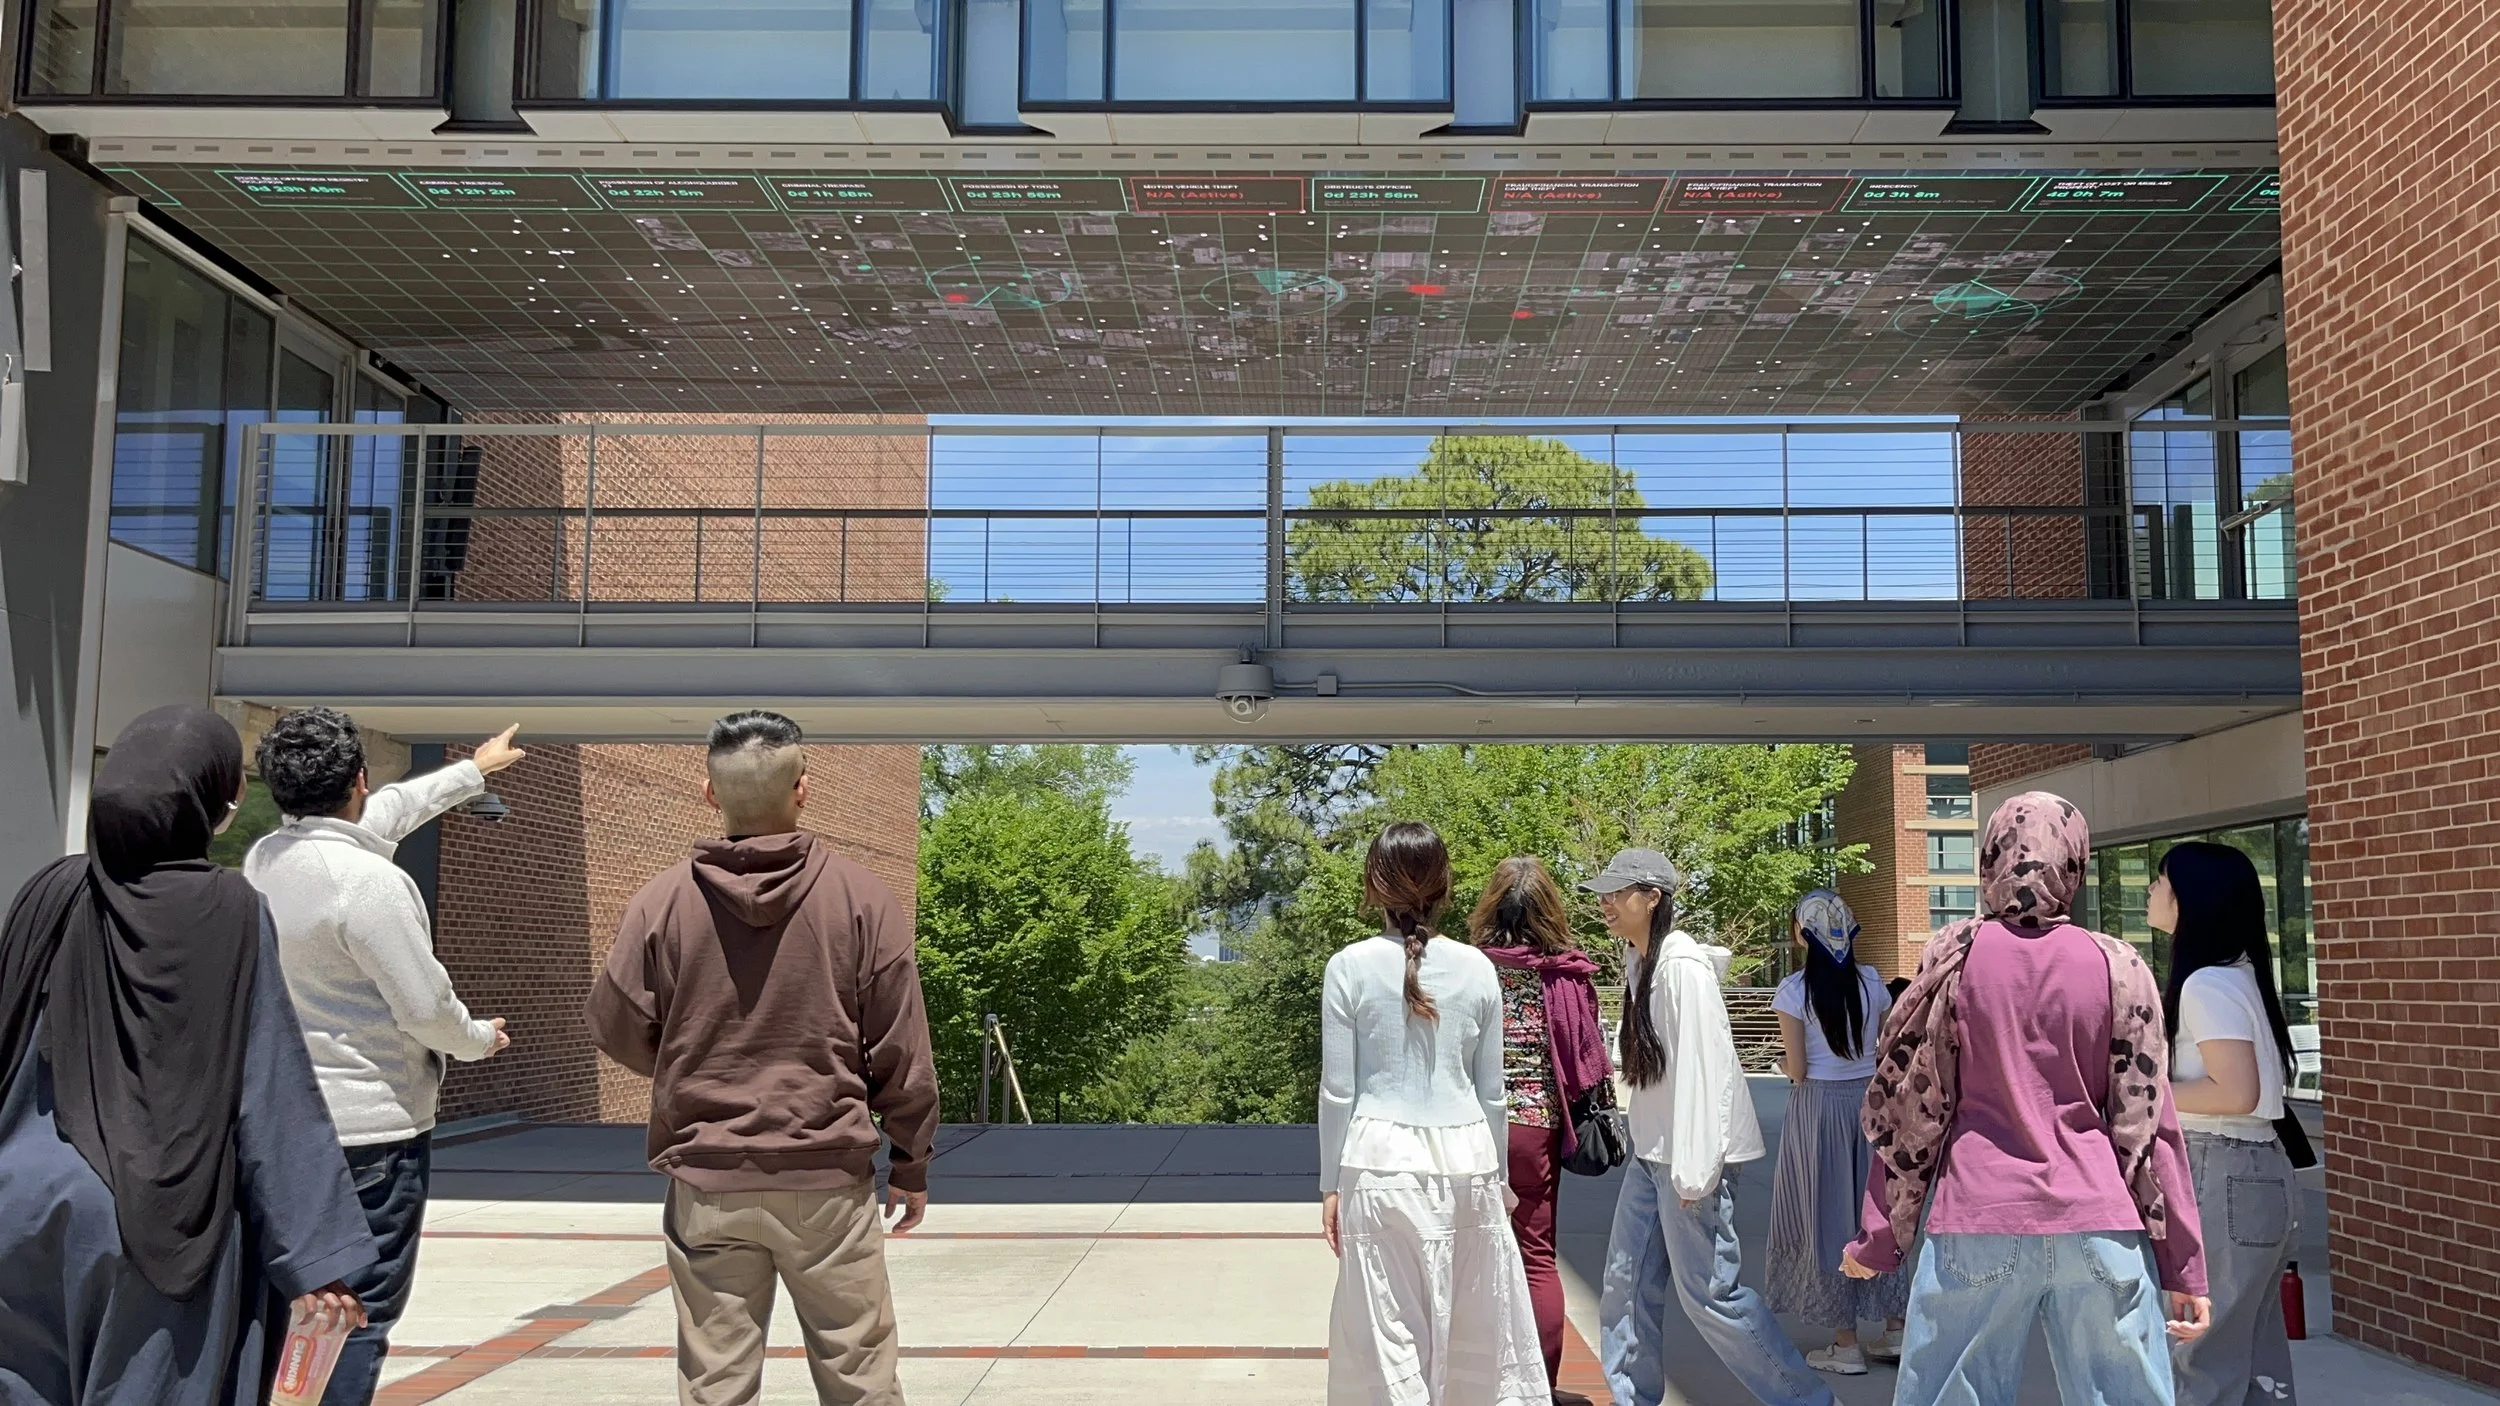
The Project Site
Georgia Tech Price Gilbert Library Media Bridge
Media Bridge is the digital screen spanning the area between Price Gilbert and Crosland Tower.
It features a main "pool" and eight separate "stream" screens running up the outside of the bridge connecting the Library's main buildings.
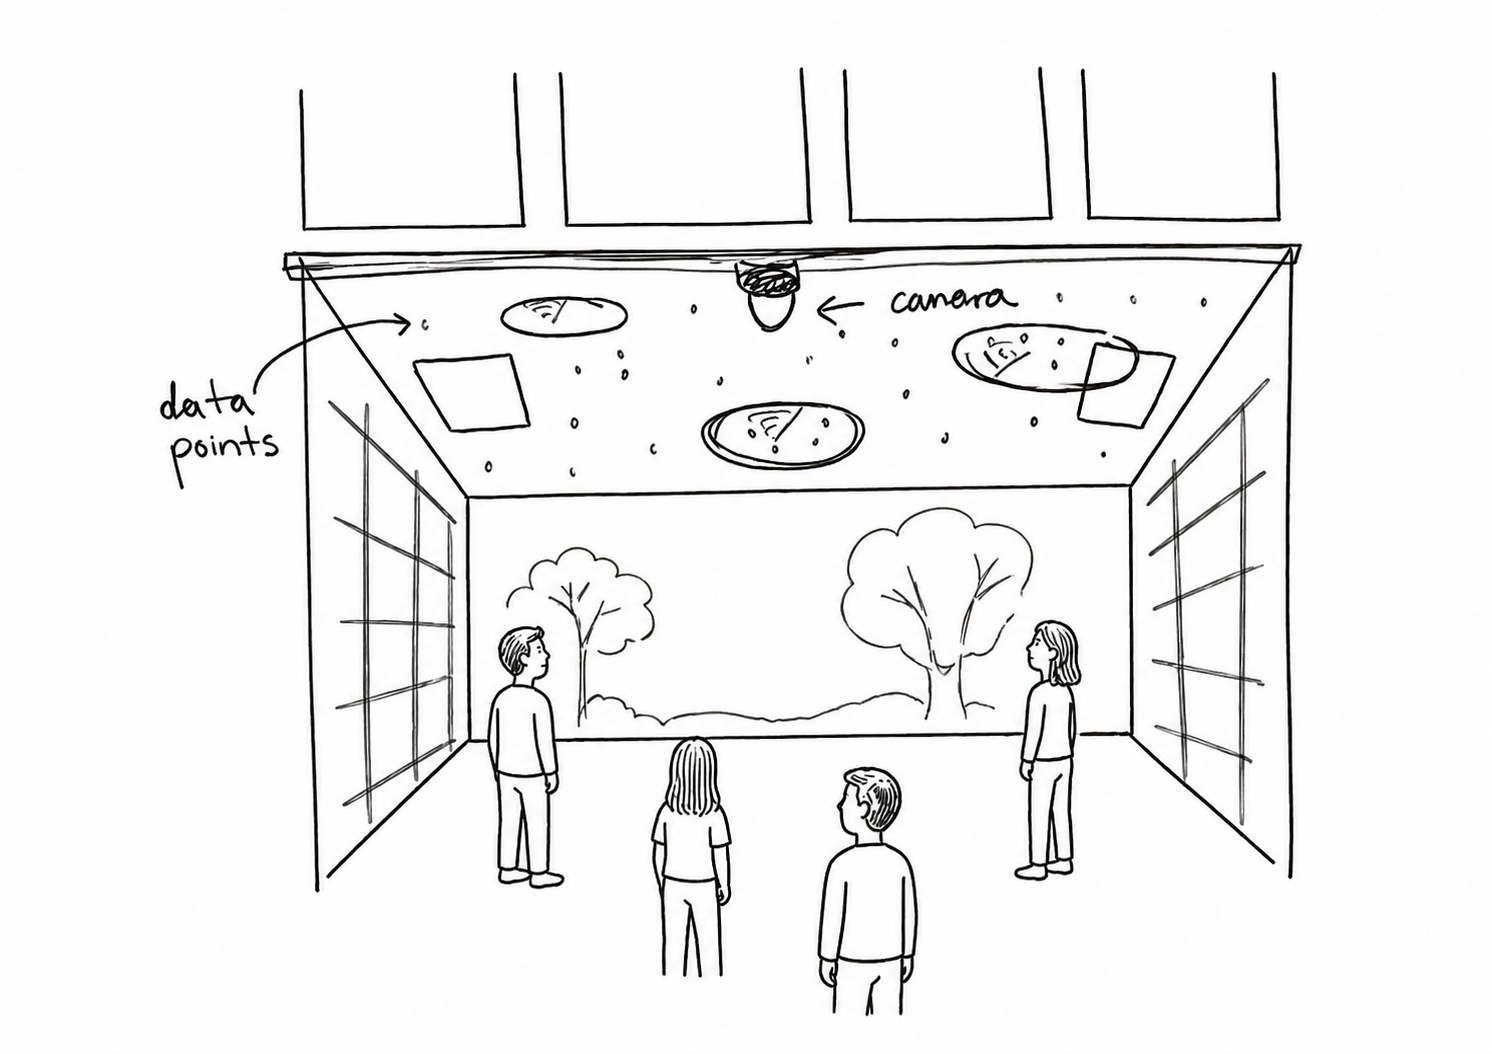
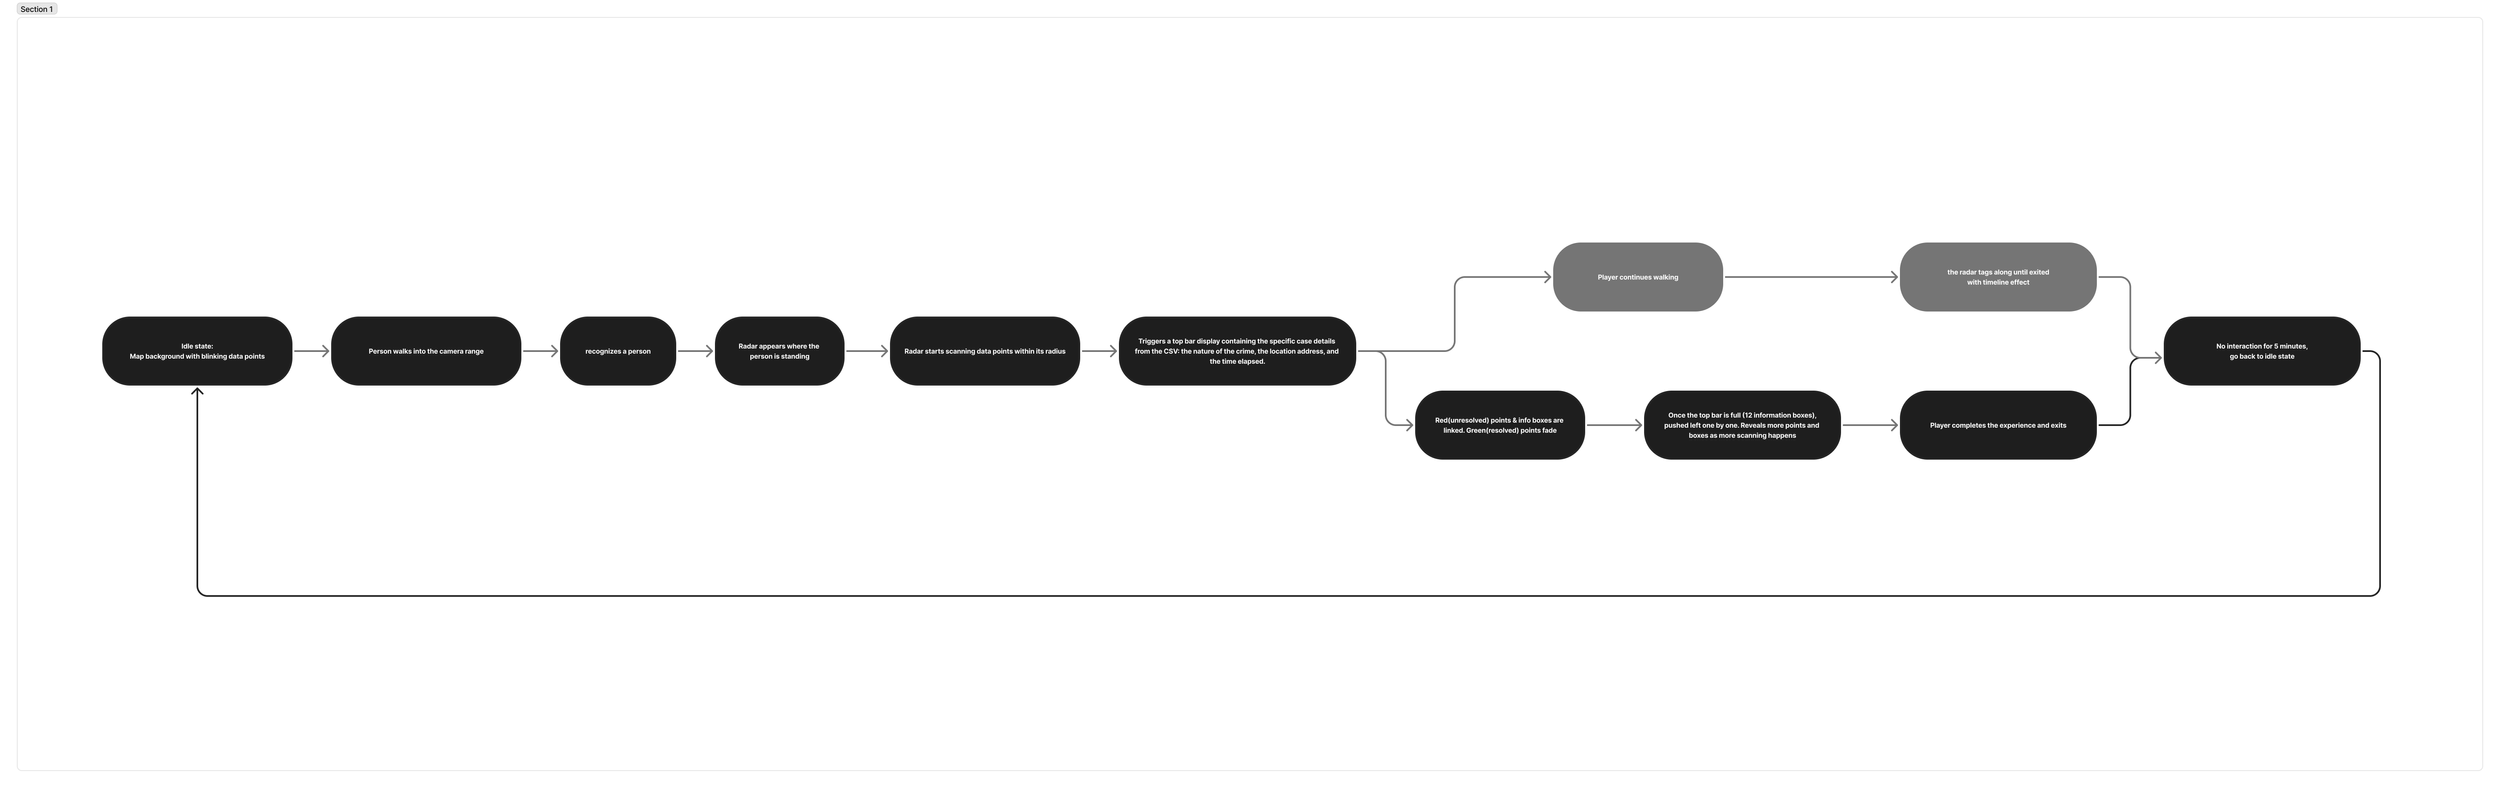
Interaction Flow
Testing & Iterations
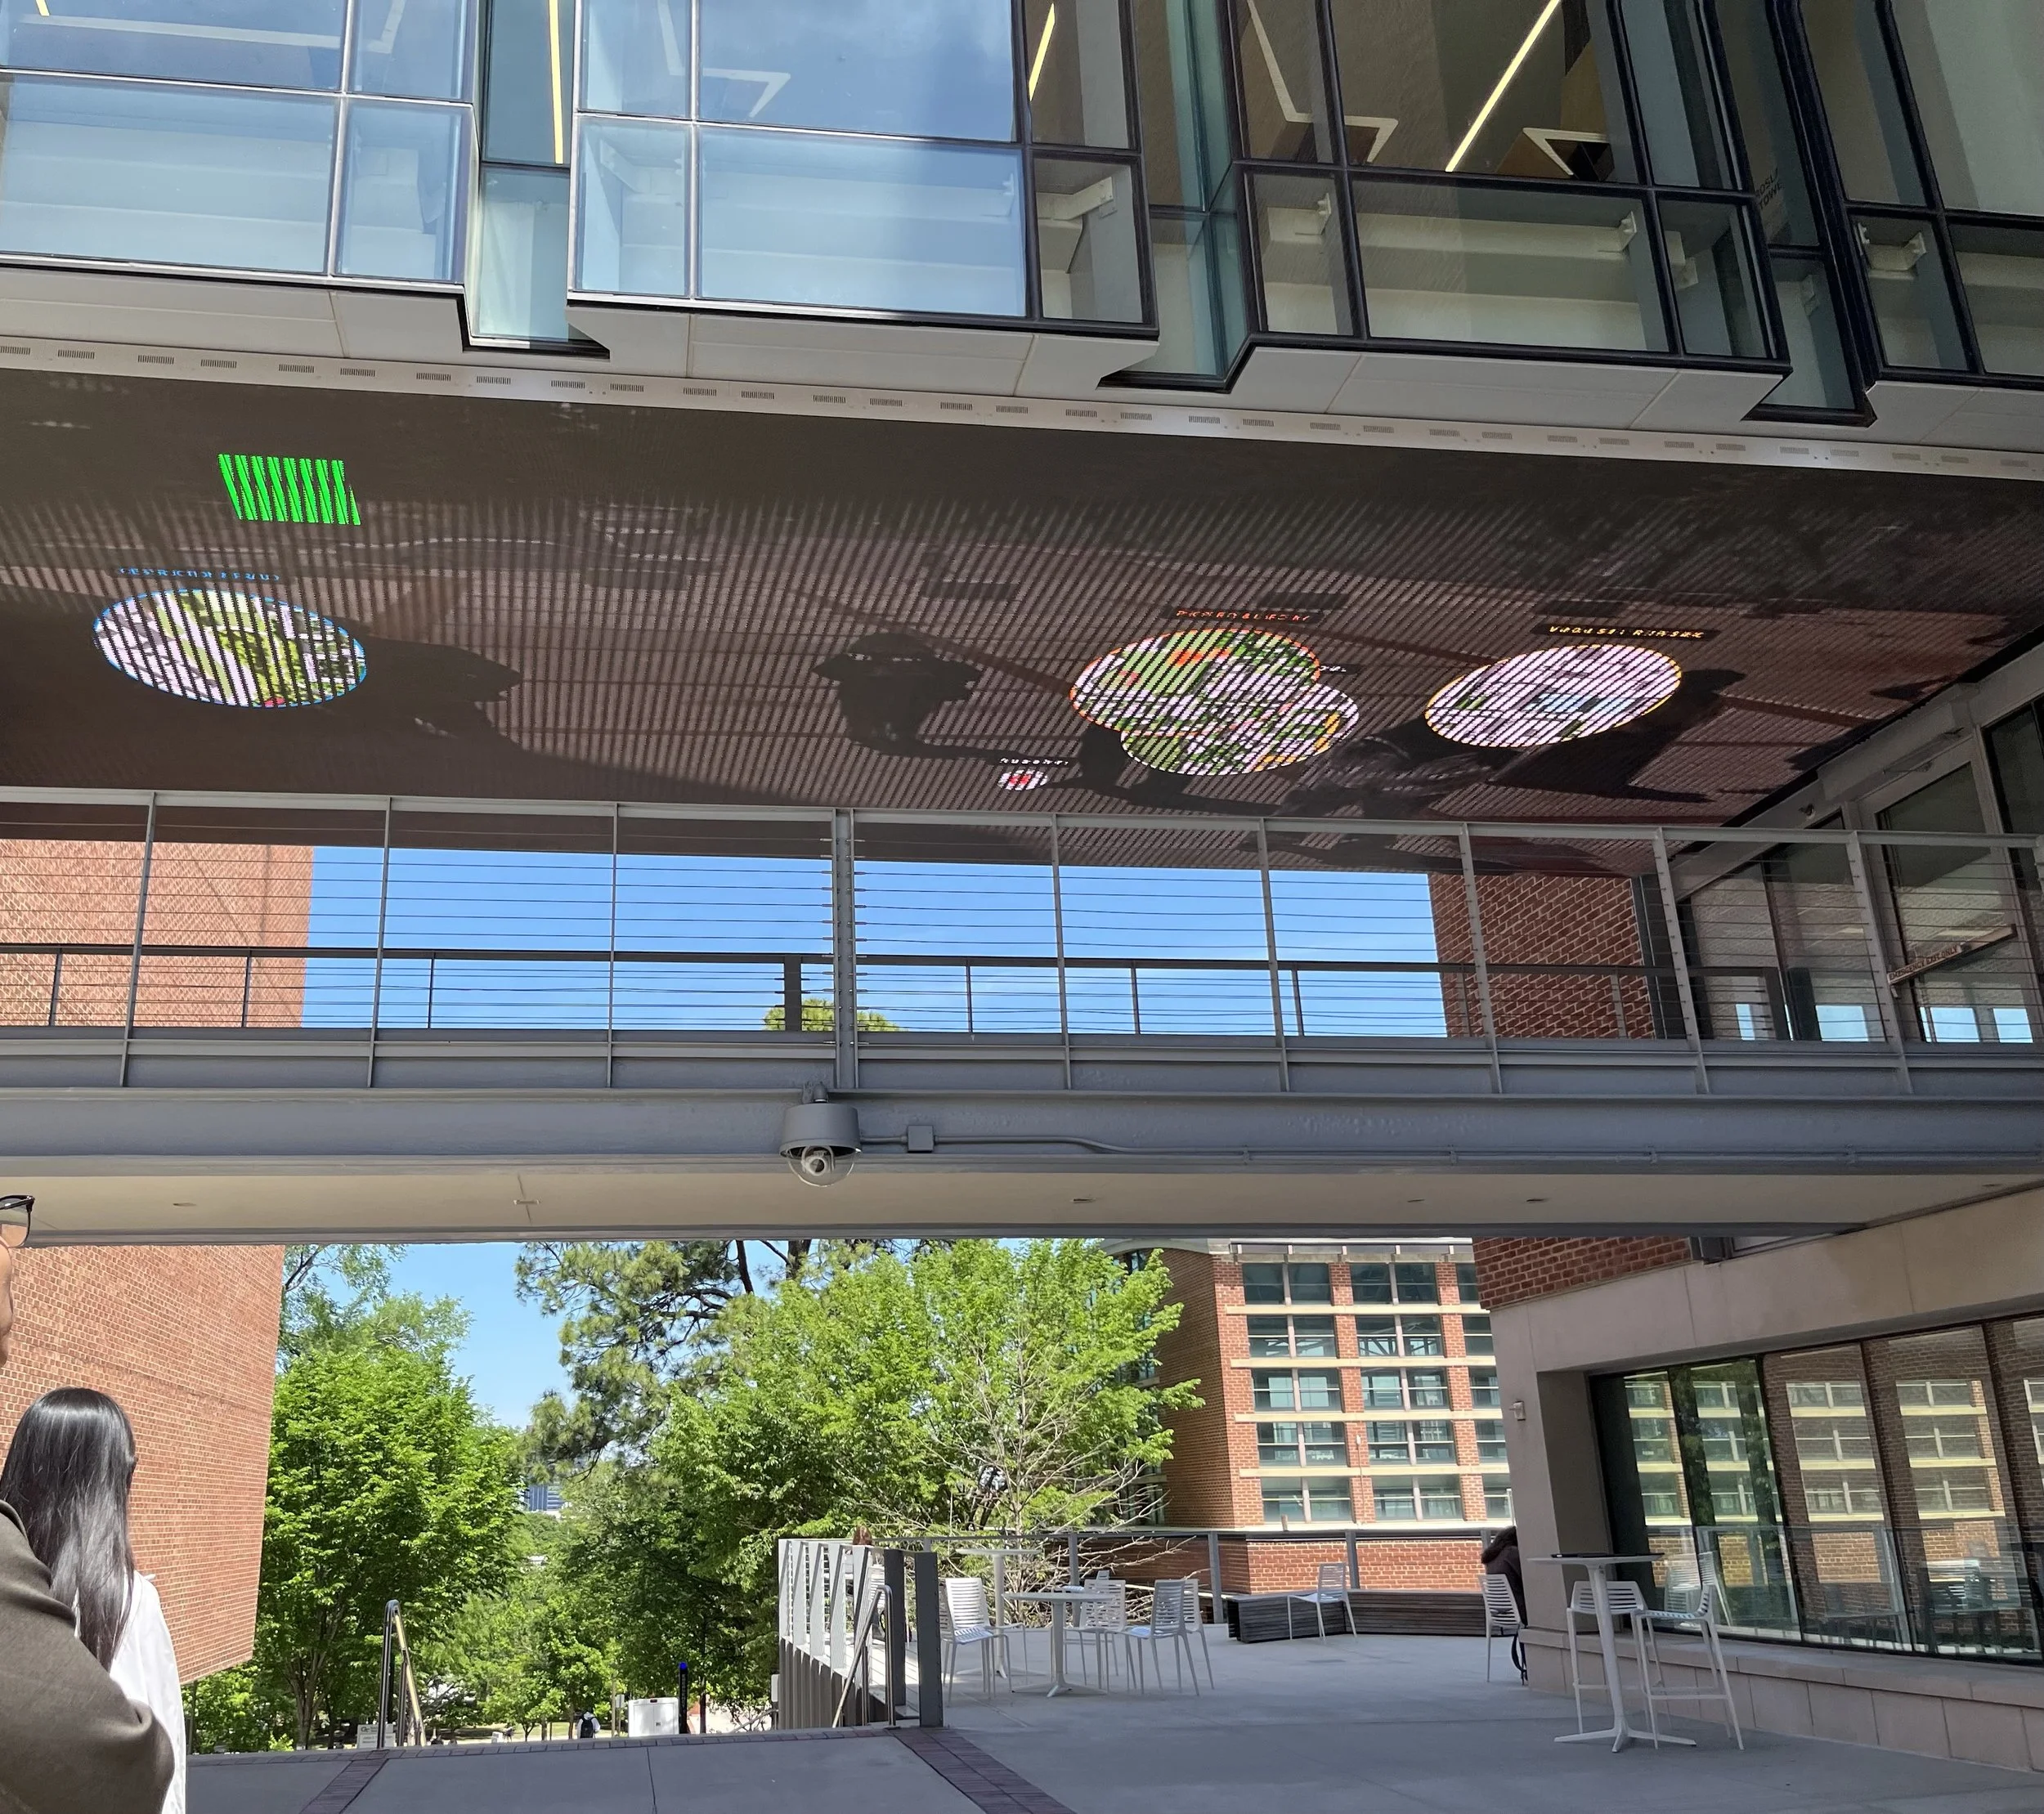
Testing Version 1 (04.21)
Goal:
Transform static spreadsheet into an immersive, spatial experience.
Challenge:
Select data that would inform students about their surroundings
Translate complex "resolution" metrics into a clear visual language.
Shift the focus from "what happened" to "what was done about it.", categorizing data by Disposition. (Resolved vs. Unresolved)
Design Process
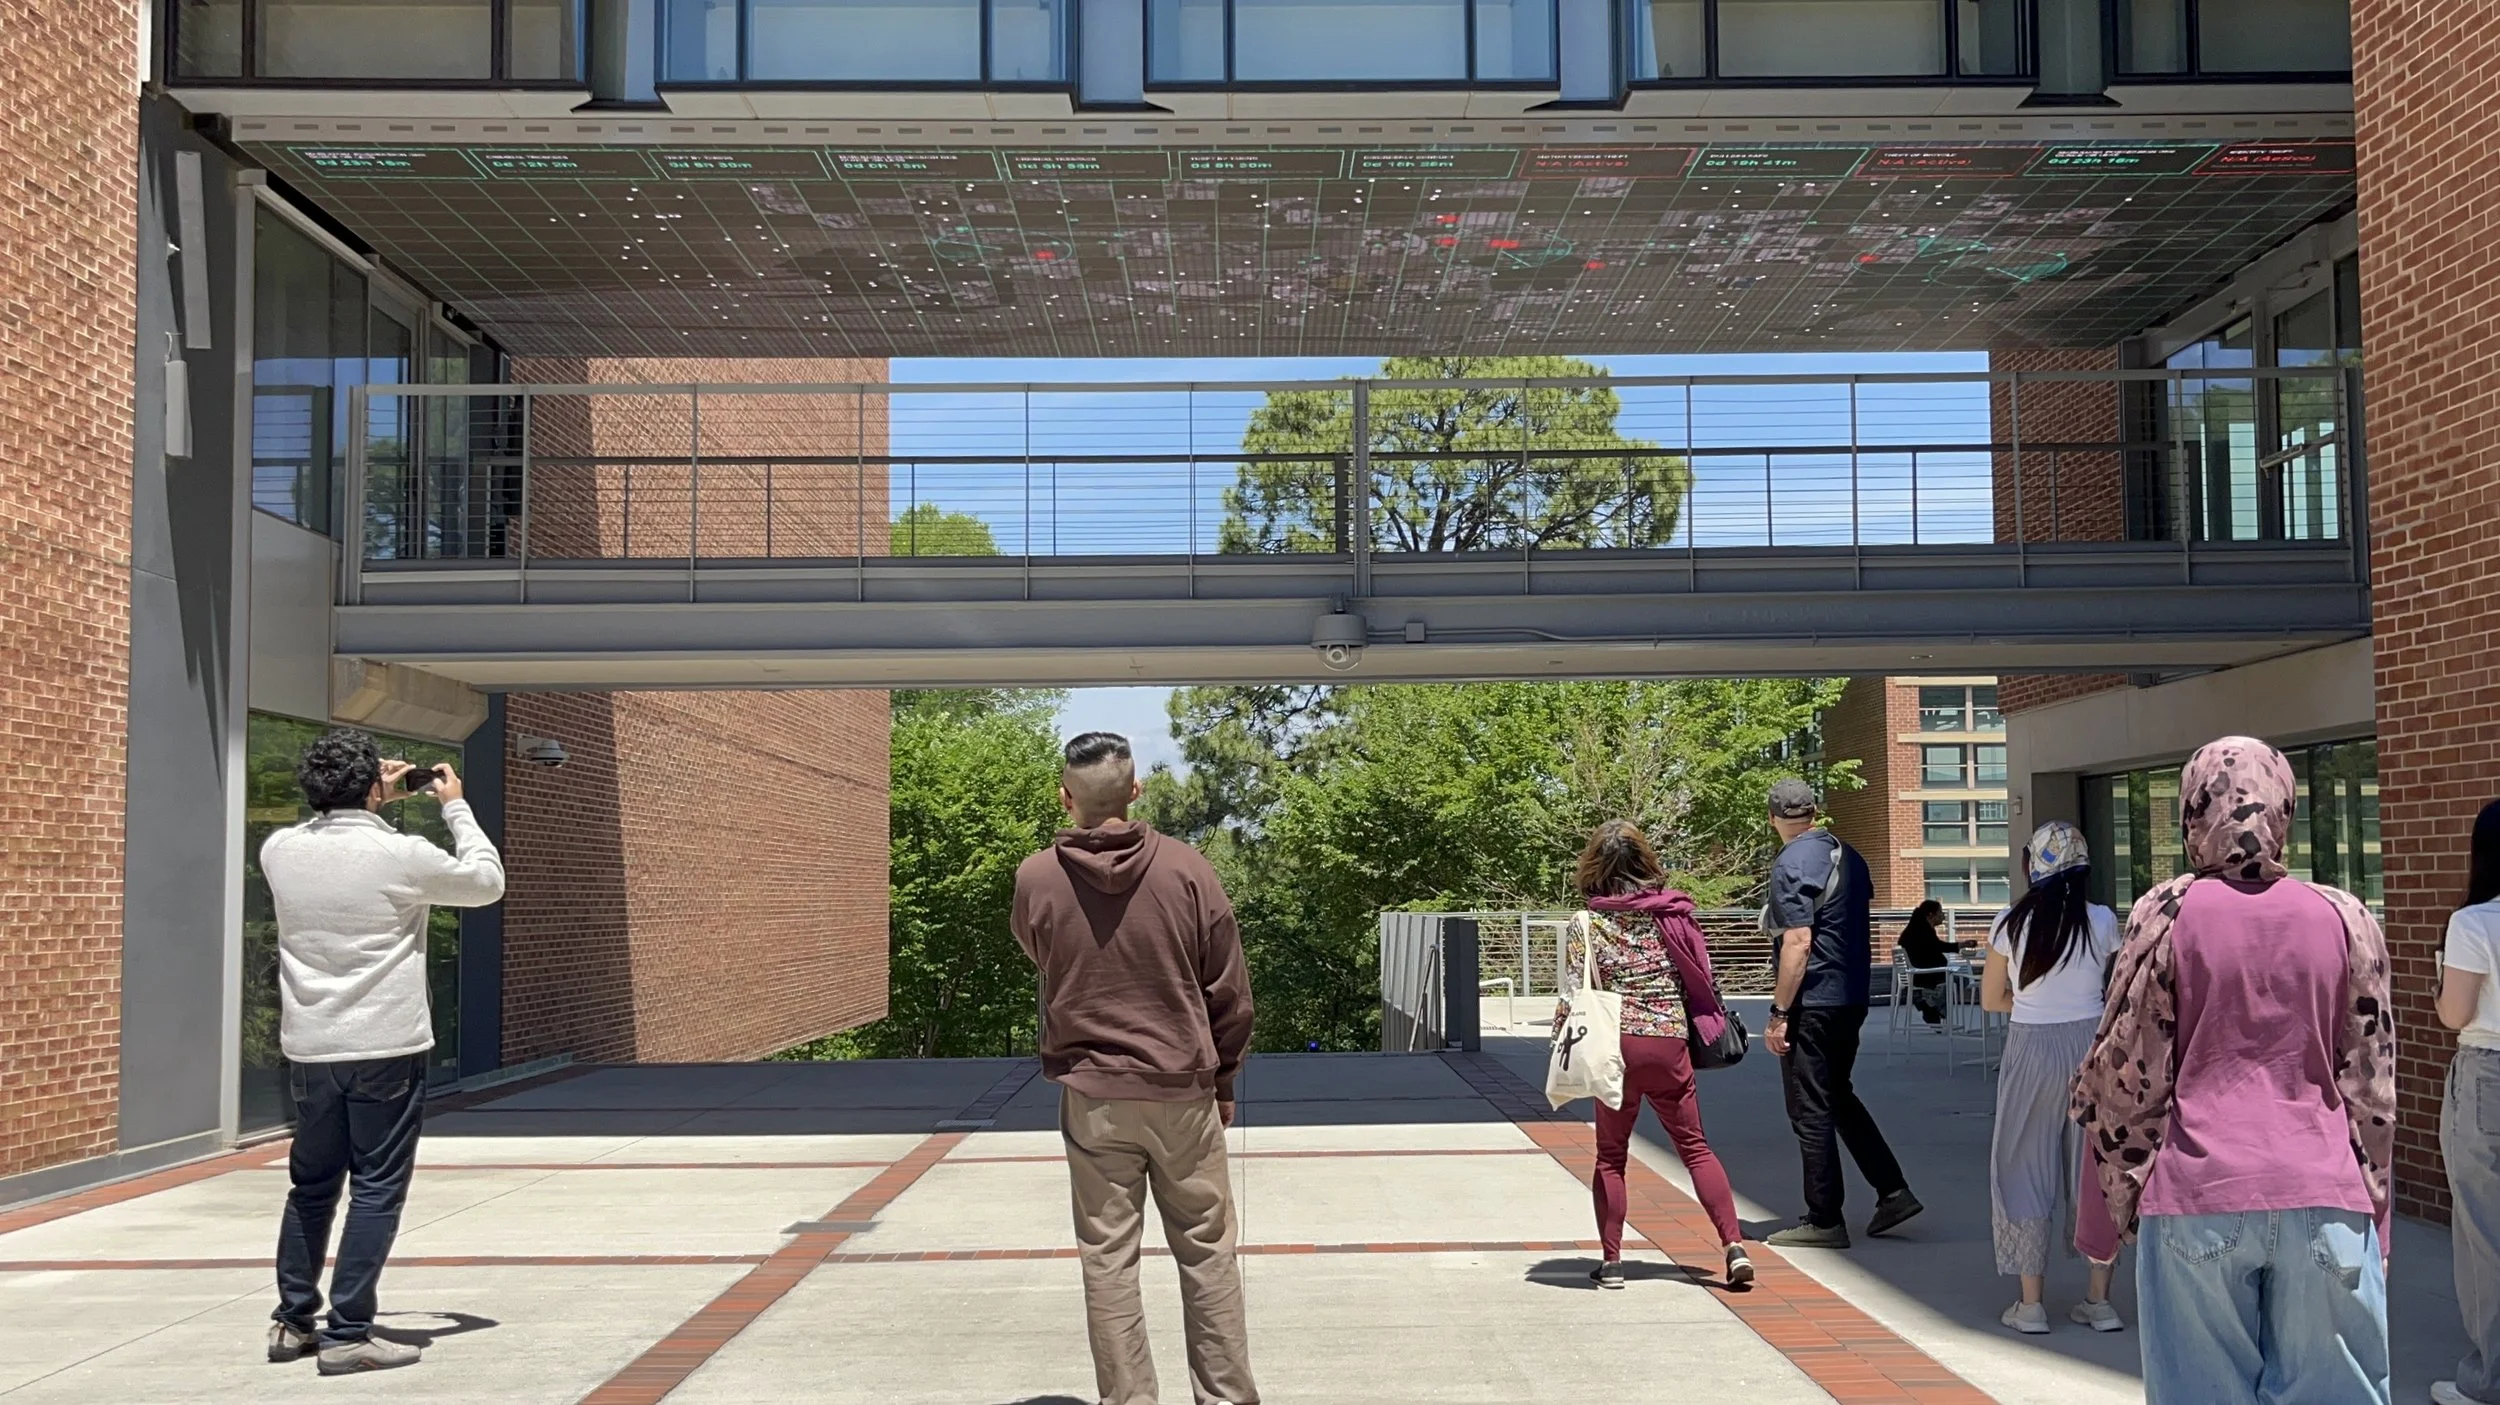
Testing Version 2 (04.30)
Feedback
Users reported difficulty linking map data to incident reports, wished they could see what point they scanned.
Feedback indicated that a centralized top-bar was more intuitive than side bar menus.
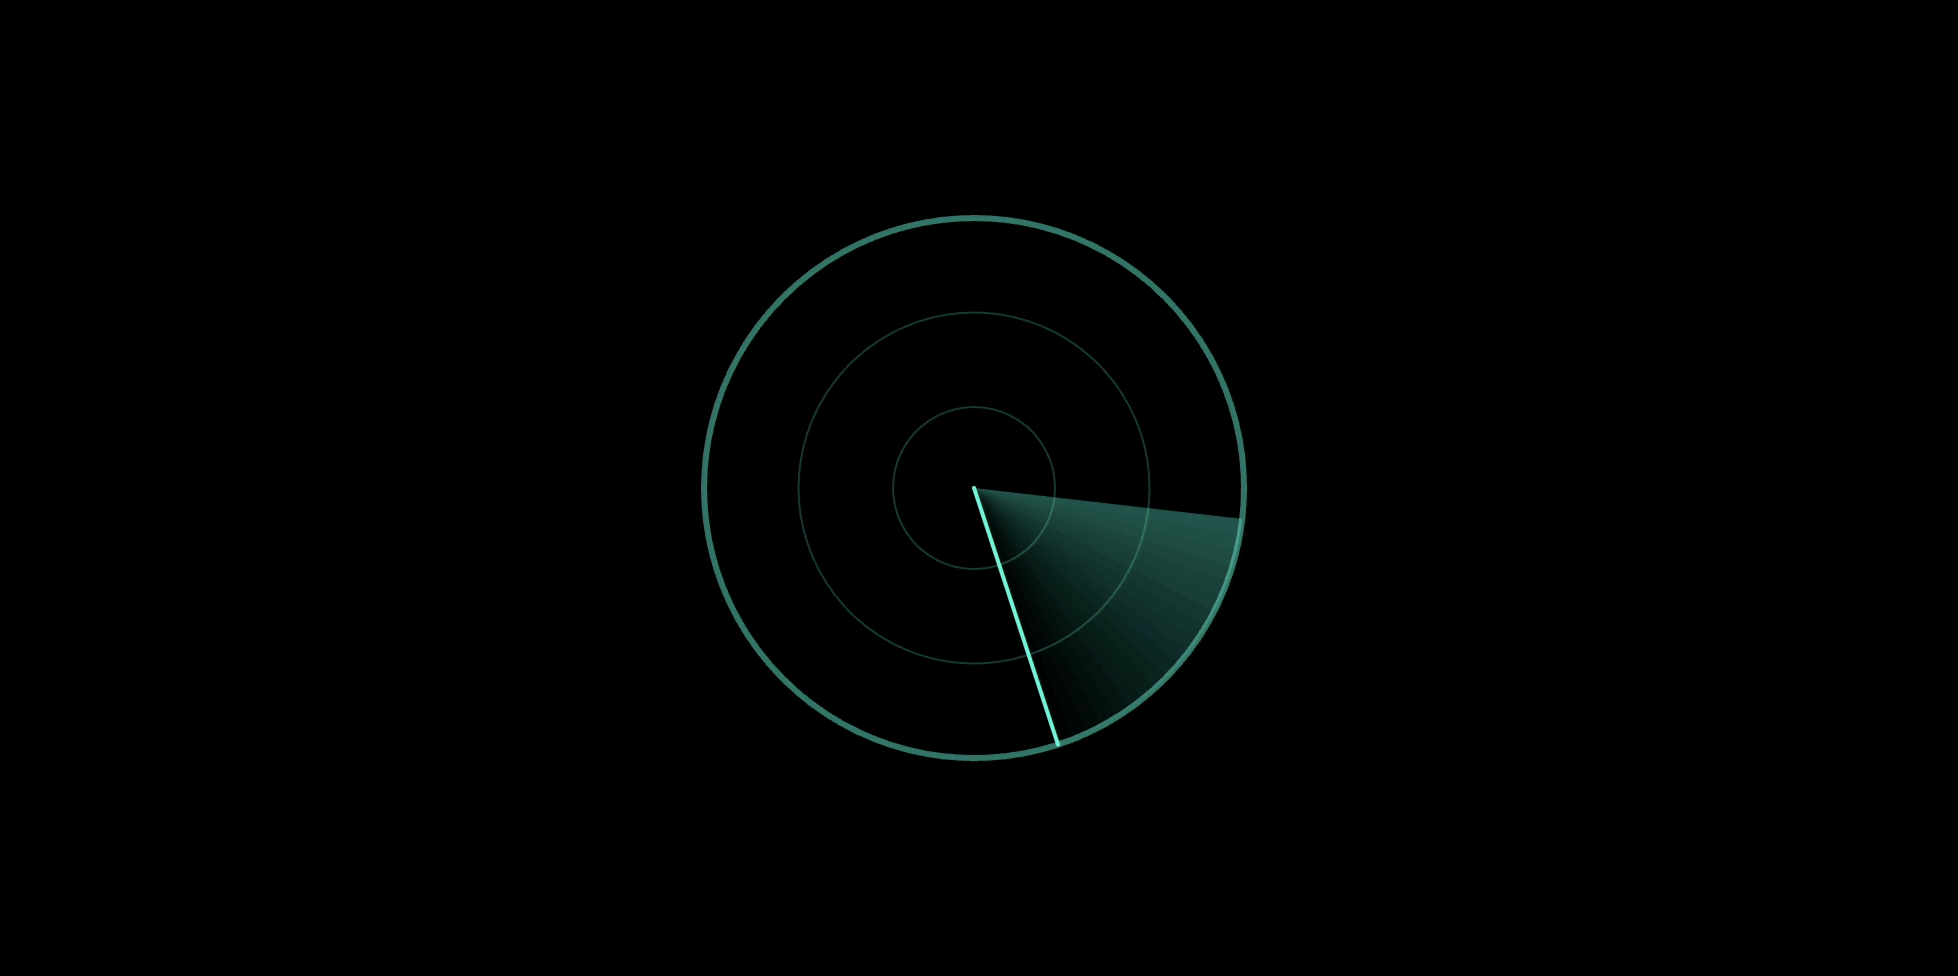
Testers suggested the radar rotation was too slow.
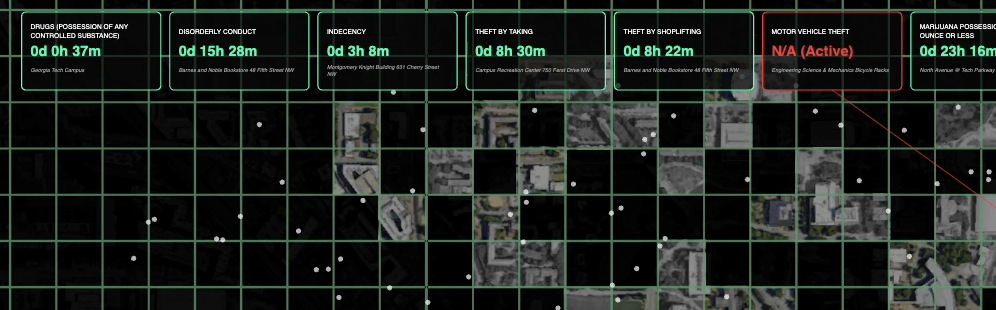
Dynamic Information Bar
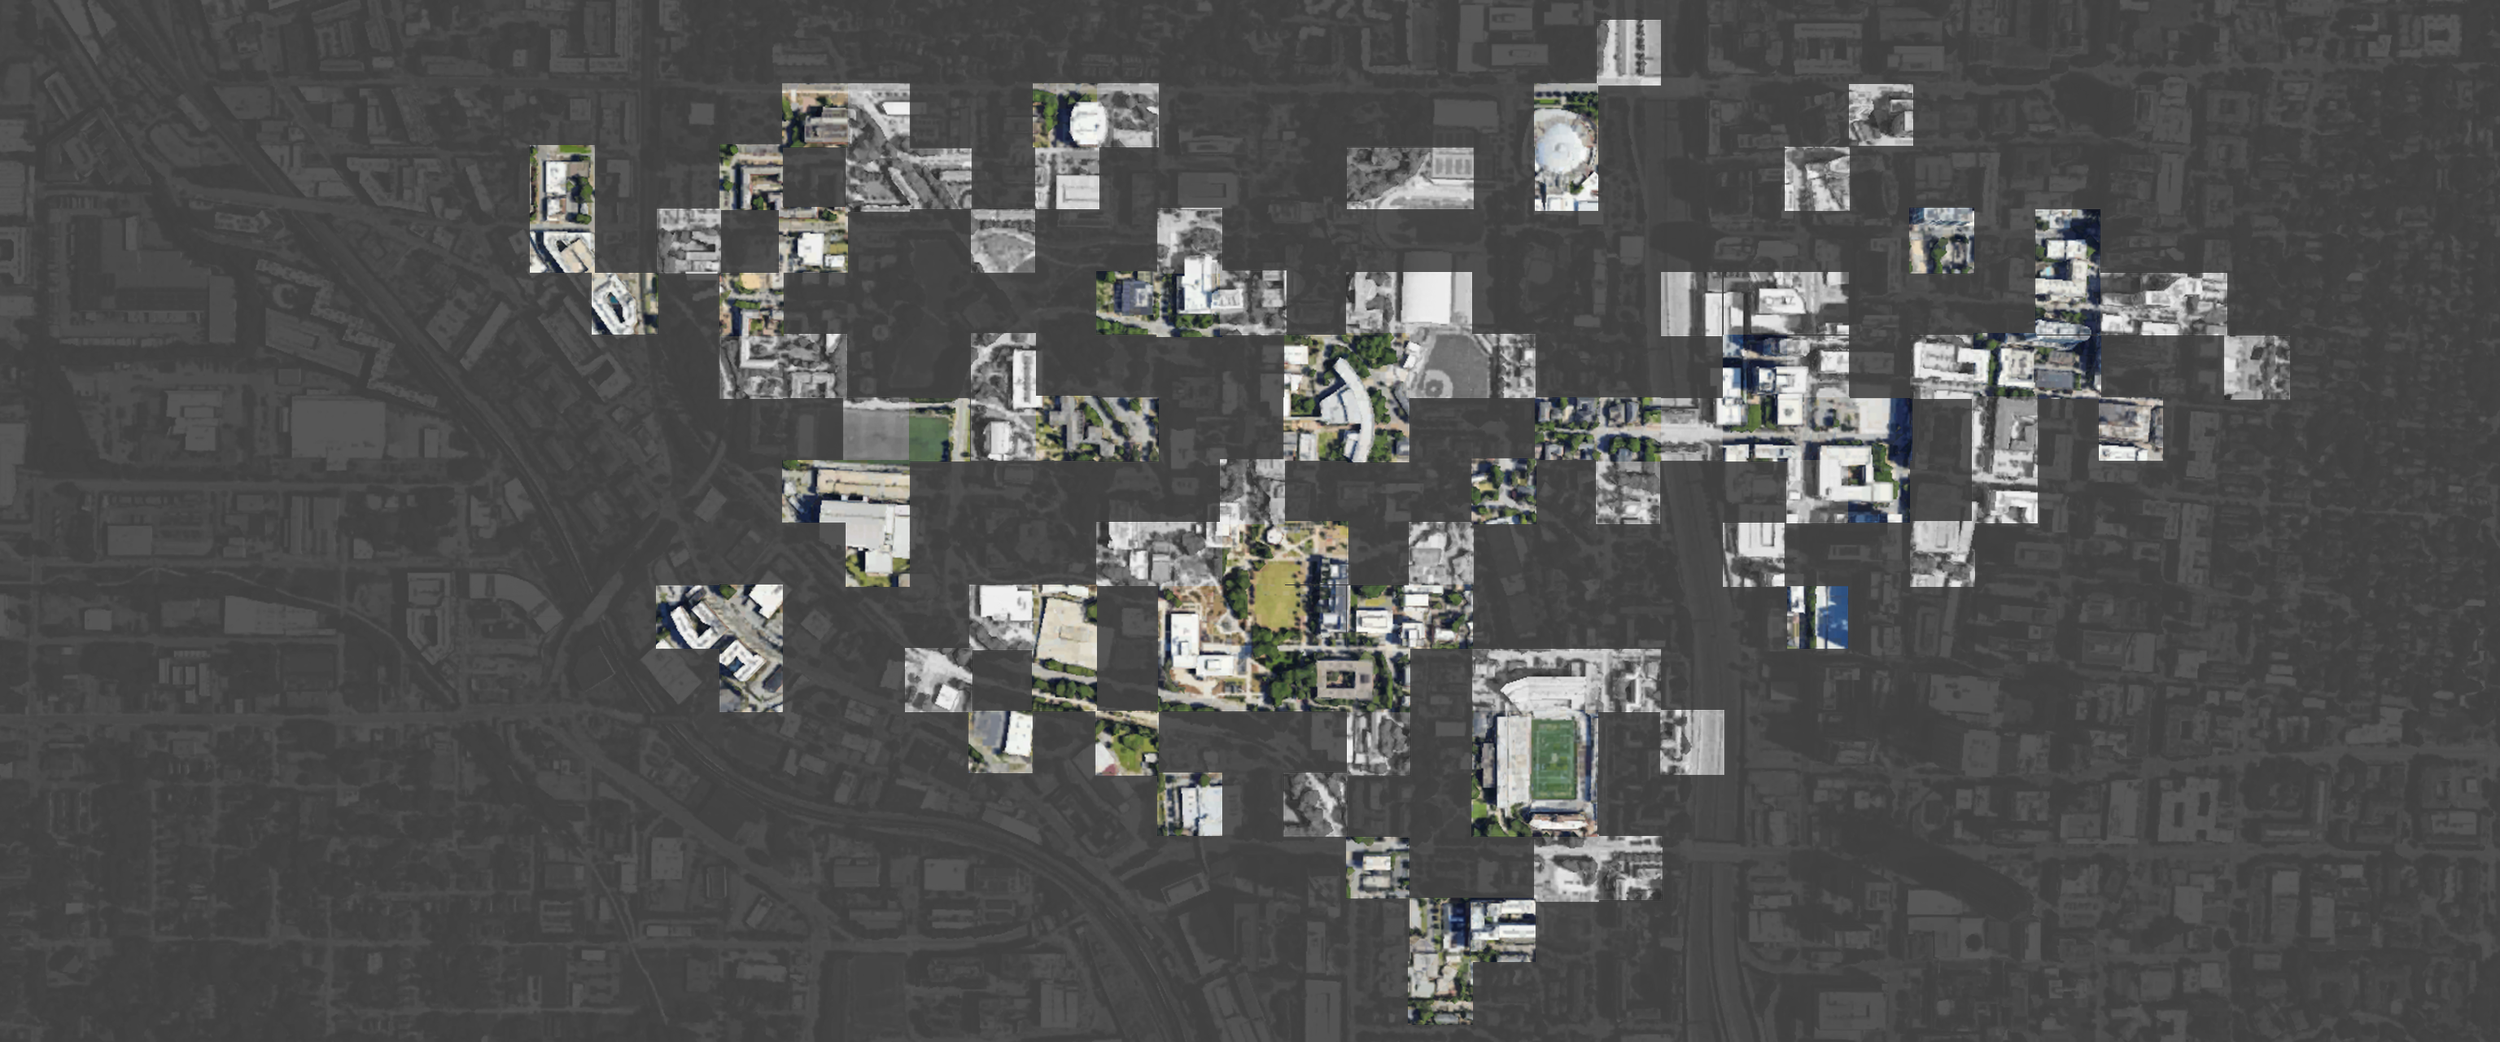
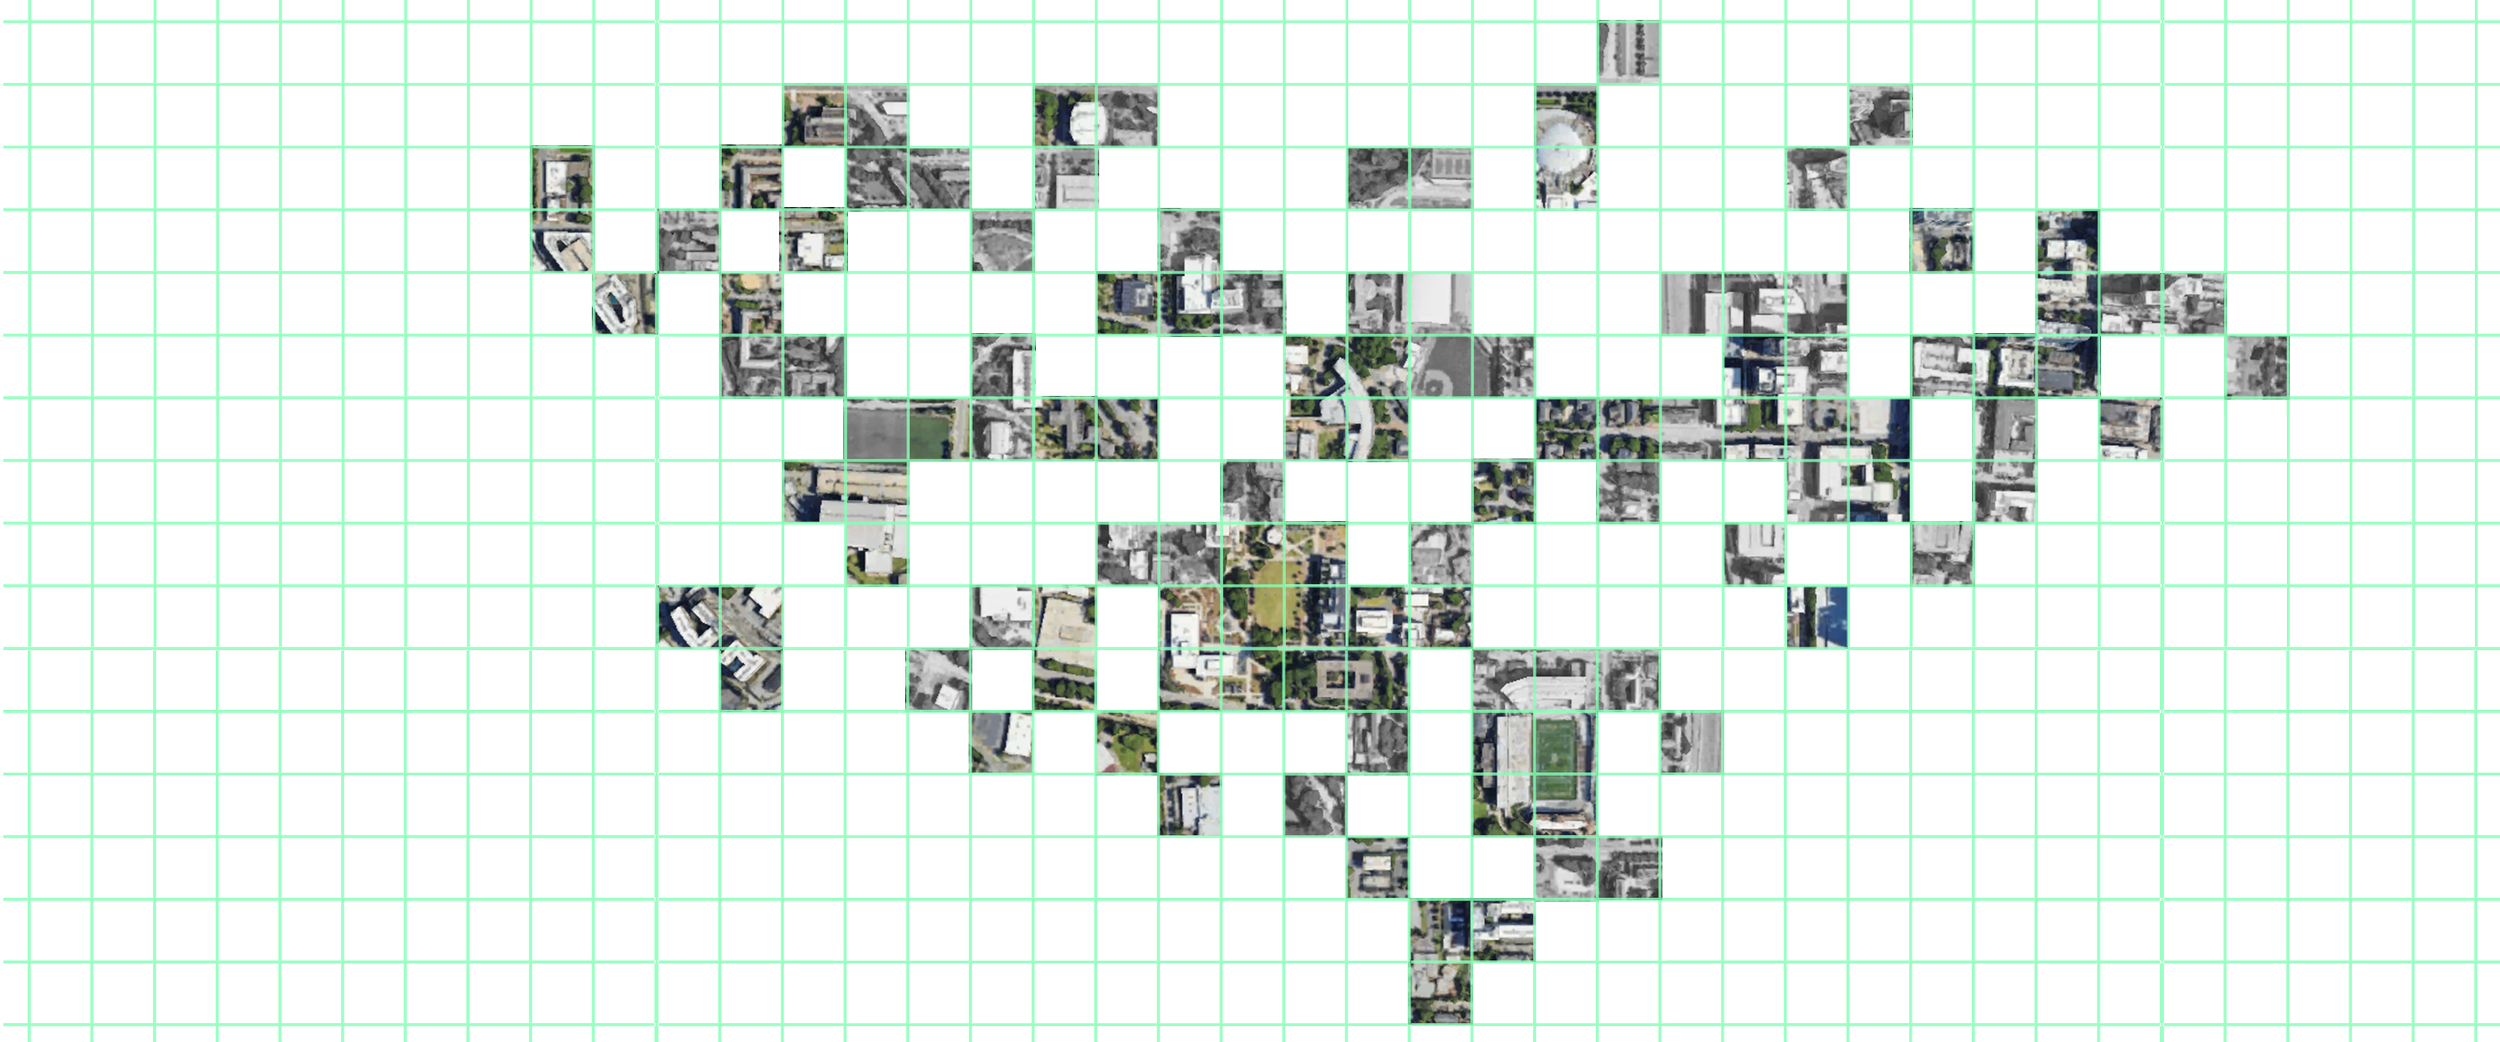
Map Design
Interactive Radar
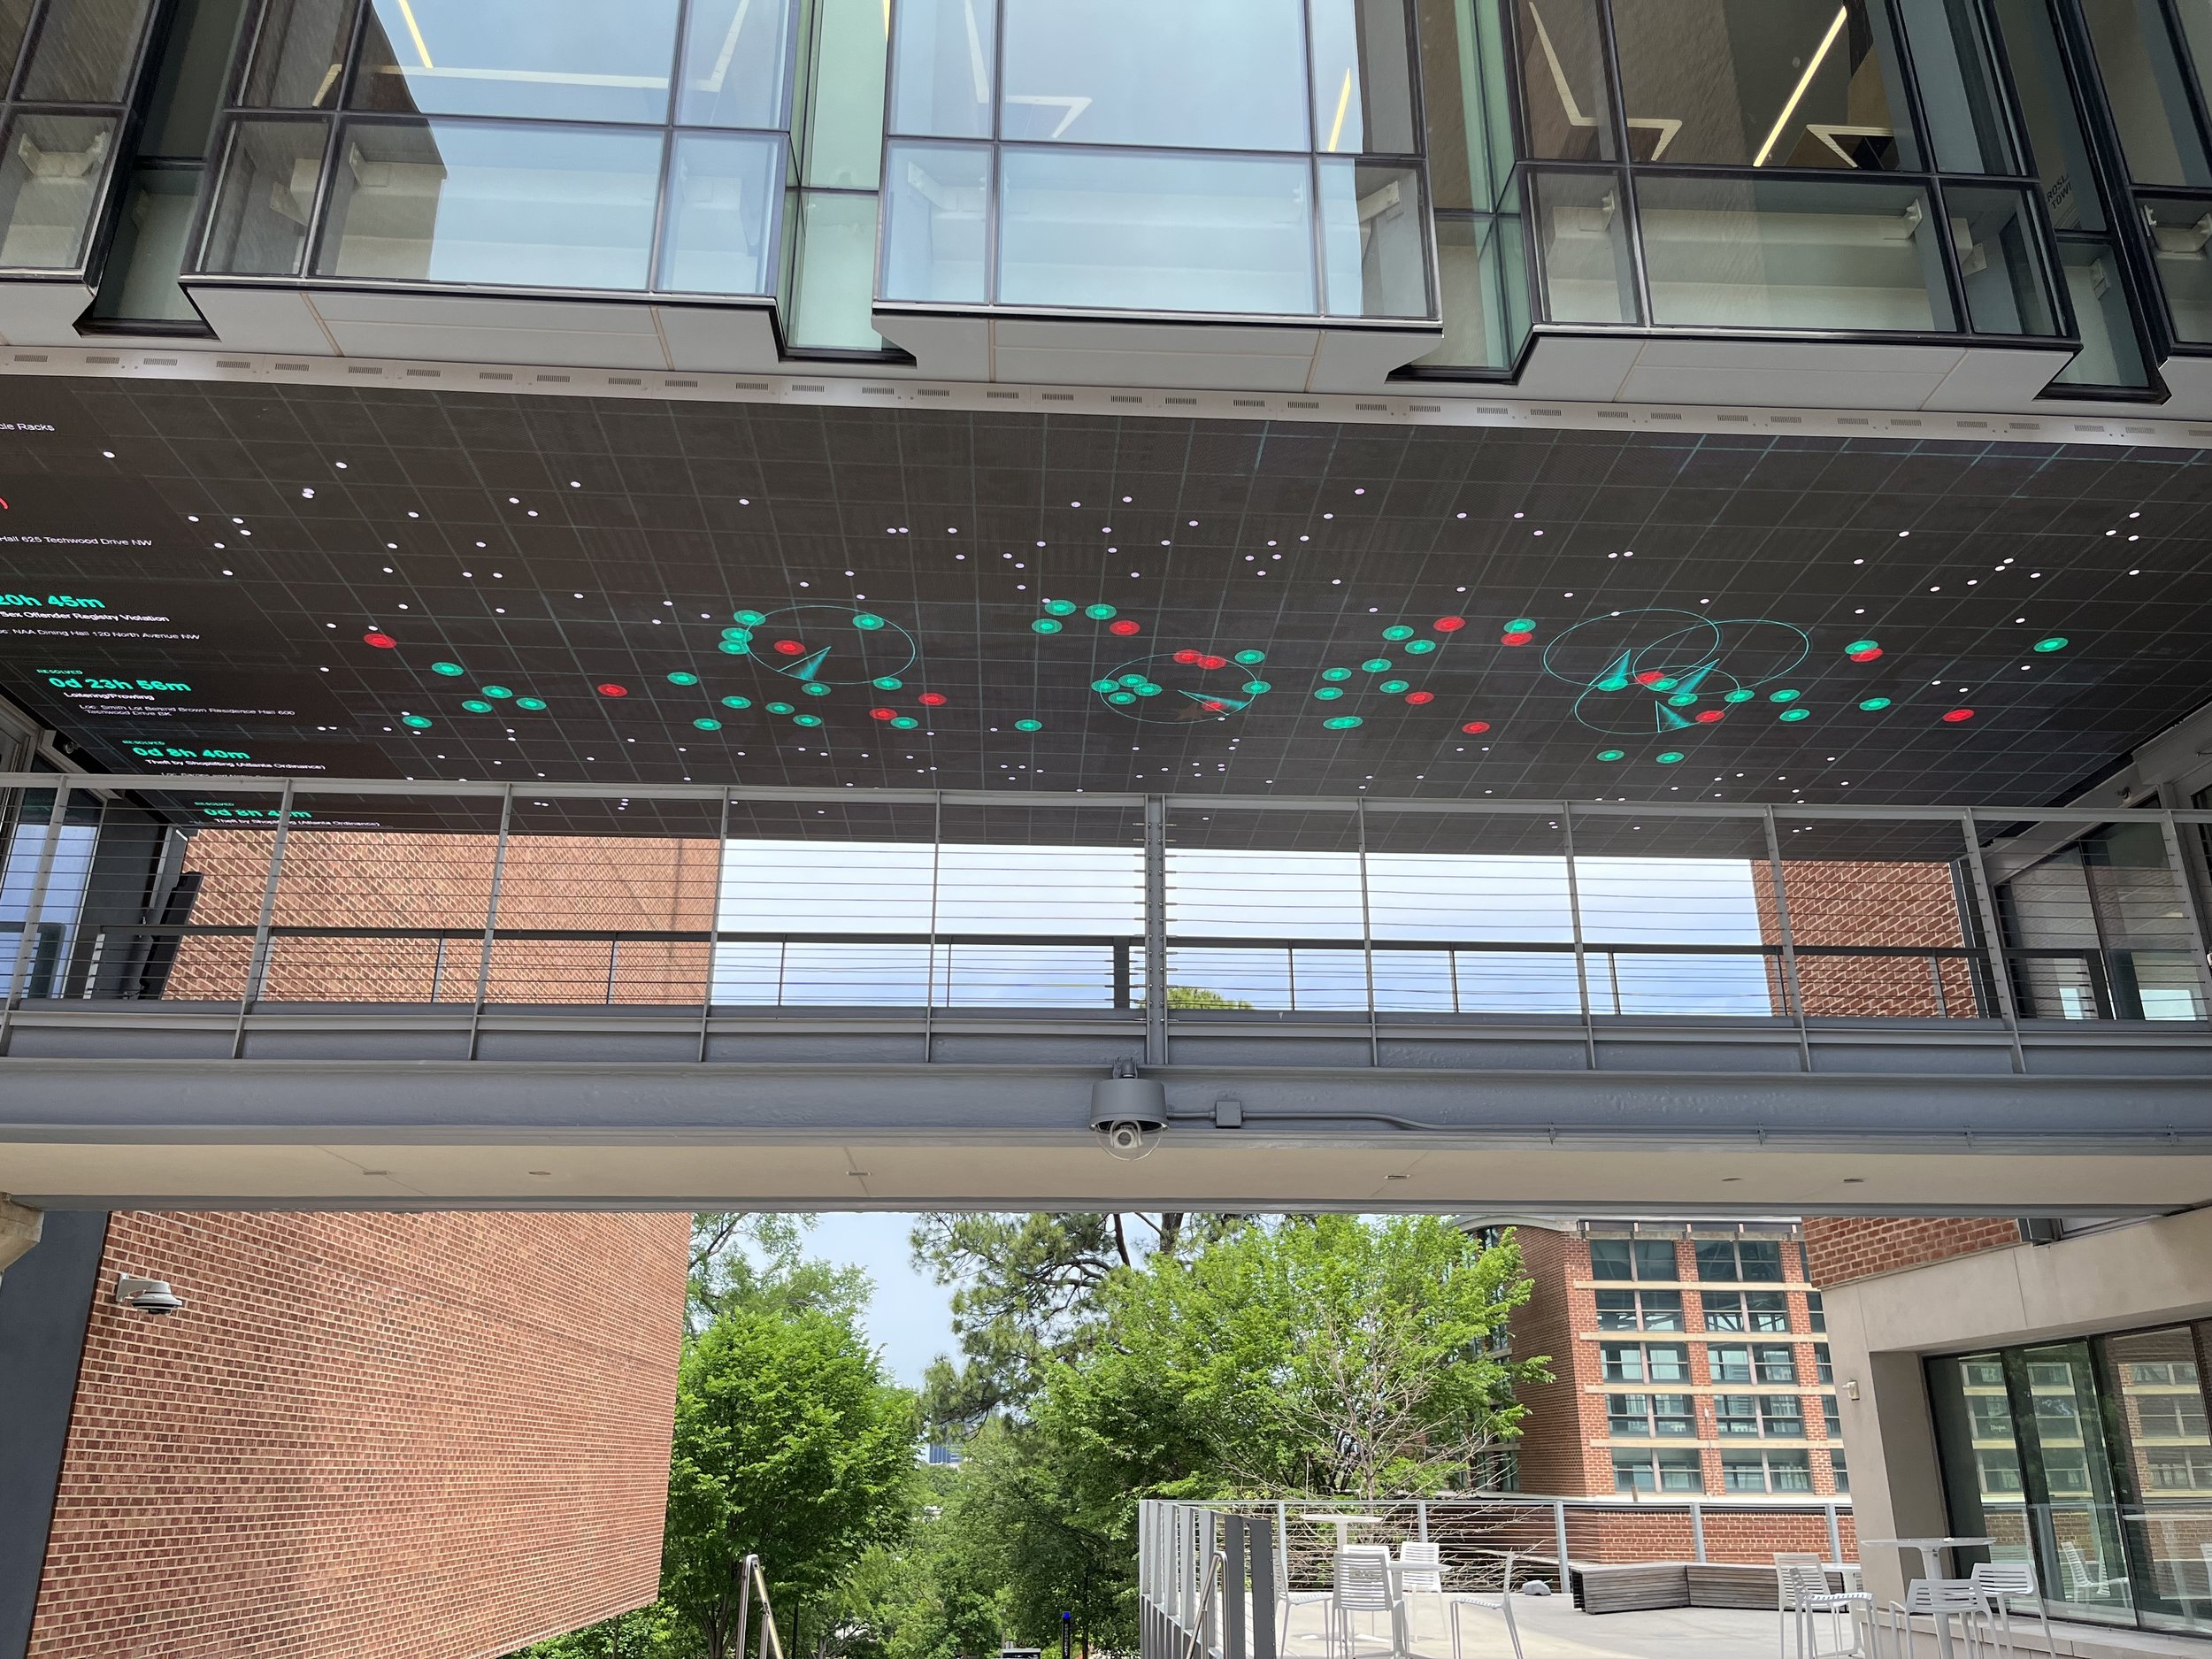
Final Design
The final design is a high-contrast tactical HUD that integrates a geospatial grid map with a multi-ring interactive radar to scan and identify urban incidents in real-time. Data is organized through a centralized top information bar where dynamic tether lines physically connect each alert card to its specific coordinate, creating a clear visual link between the information and the environment.
Final Installation
This project was part of course LMC 6650 Project Studio: Experiential Data Visualization. Taught by Dr. Yanni Loukissas